Welcome to the Histogram Builder tutorial.
You can watch the tutorial video, read the step by step text tutorial or go through the step by step screenshots tutorial:
To follow along, you can download the Excel file used in this tutorial
Step by Step Text Tutorial
1. In Excel, select a range of data. It can be one row or multiple rows, the application will use all the numerical data in the selected range.
2. Click on the Histogram Builder icon in the ADD-INS toolbar. The Histogram Builder window will open and you will see the selected data range coordinates in the Data Range field.
3. Click on “Show Descriptive Statistics” button.
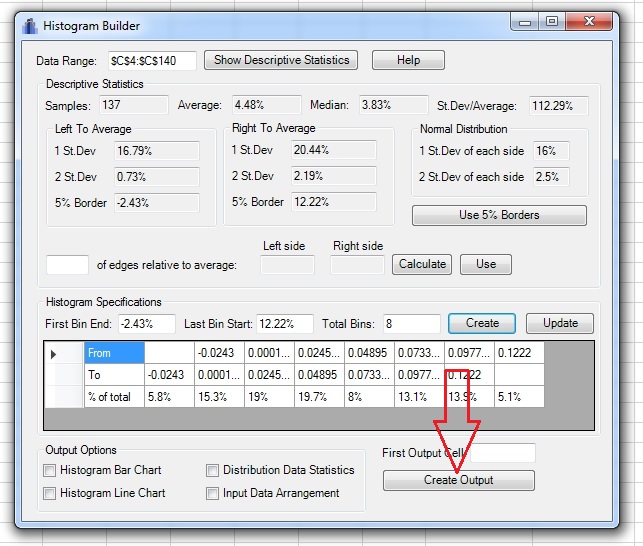
4. You will see the descriptive statistics of the collection of numbers found in the selected range:
- Number of samples, their average, median and the ratio of standard deviation to average.
- How closely the distribution of the data resembles a normal distribution by comparing the quantity of samples in a distance of 1 and 2 standard deviations from the average.
- The sample which is located in the 5% range from the start and 5% range from the end of the data. You can use those numbers to determine the most left and most right edges of the histogram. If you want to use those borders, click on “Use 5% Borders” button.
5. You can use the edges calculator to determine the edges of the histogram. Input the percentage of samples you want to be included in the most left and most right bins and click on the “Calculate” button. Histogram Builder will calculate and show the edges of the bins according to your selection. The calculation is based on distance from the average, so the edges might not be parallel. If you want to use those borders, click on “Use” button.
6. Under Histogram Specifications, enter the borders of the bins on the edges and total number of bins. Note that the default of Histogram Builder is a histogram with 10 bins, and that the bins would be evenly distributed between the selected borders. Click on the “Create”button in order to view the data of the histogram.
7. You can see the ranges of the bins of the histogram and the ratio of samples in each bin compared to the total sample. If you want, you can change the borders of the bins using one rule: the “From” of the current bin must be the same as the “To” of the previous bin. If you made changes to the borders, click on the “Update” button to update the histogram.
8. Choose the desired output. Histogram Builder will export the data found in the Histogram Specifications table and the additional options which you may select:
- Histogram Bar Chart will output a bar chart of the histogram.
- Histogram Line Chart will output a line chart of the histogram.
- Distribution Data Statistics will compute the average of samples in each bin
- Input Data Arrangement will create a list of the samples in each bin
9. Select the first output cell by clicking on the First Output Cell field, clicking on the cell in the spreadsheet and returning to the Histogram Builder window.
Note: If the range input field is not empty, you need to delete existing text before selecting a new range in the spreadsheet.
10. Click on the “Create Output” button. If the output range in the spreadsheet is not empty, Histogram Builder will ask if you want to paste the data anyway.
Step by Step Screenshots Tutorial:
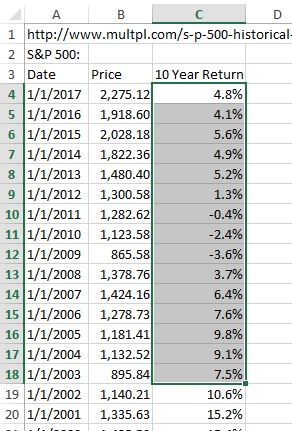
1. In Excel, select a range of data. It can be one row or multiple rows, the application will use all the numerical data in the selected range:
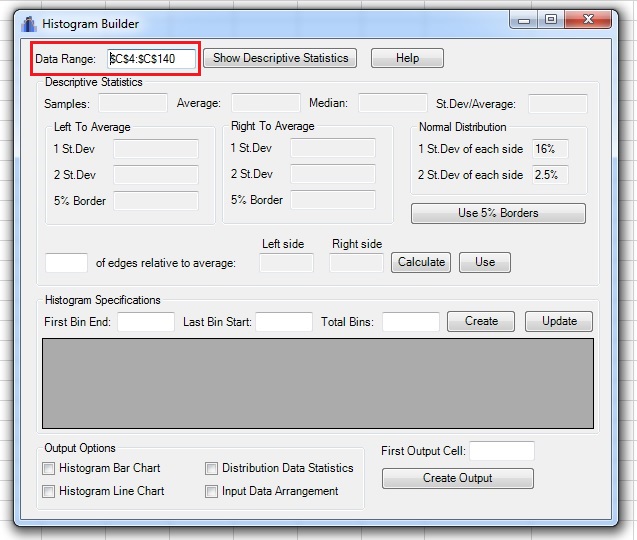
2. Click on the Histogram Builder icon in the ADD-INS toolbar. The Histogram Builder window will open and you will see the selected data range coordinates in the Data Range field:
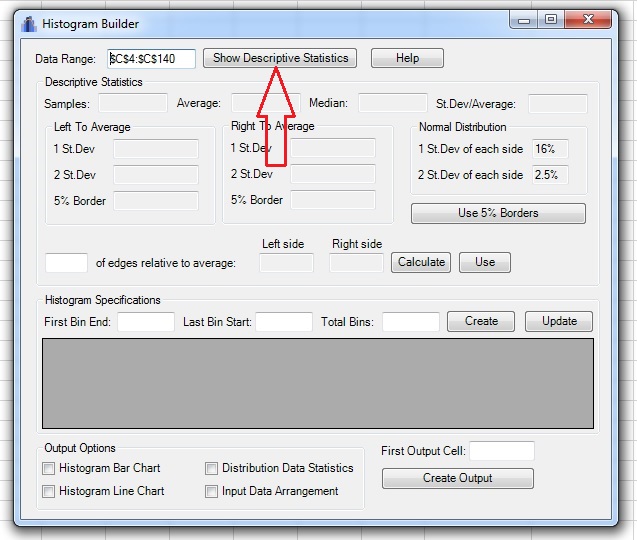
3. Click on “Show Descriptive Statistics” button:
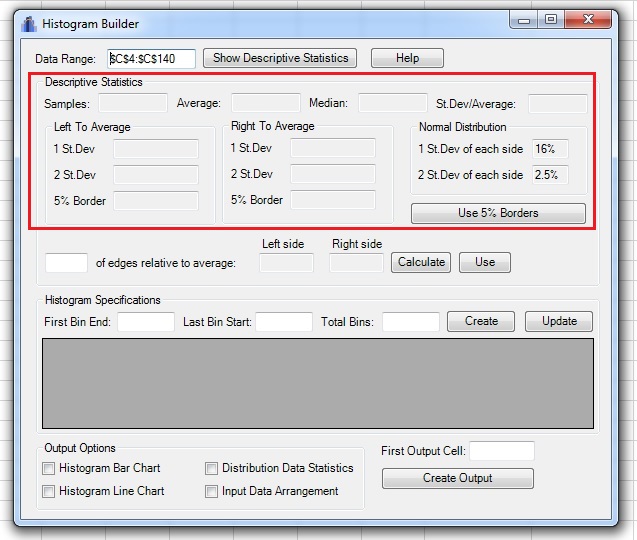
4. You will see the descriptive statistics of the collection of numbers found in the selected range:
- Number of samples, their average, median and the ratio of standard deviation to average.
- How closely the distribution of the data resembles a normal distribution by comparing the quantity of samples in a distance of 1 and 2 standard deviations from the average.
- The sample which is located in the 5% range from the start and 5% range from the end of the data. You can use those numbers to determine the most left and most right edges of the histogram. If you want to use those borders, click on “Use 5% Borders” button.
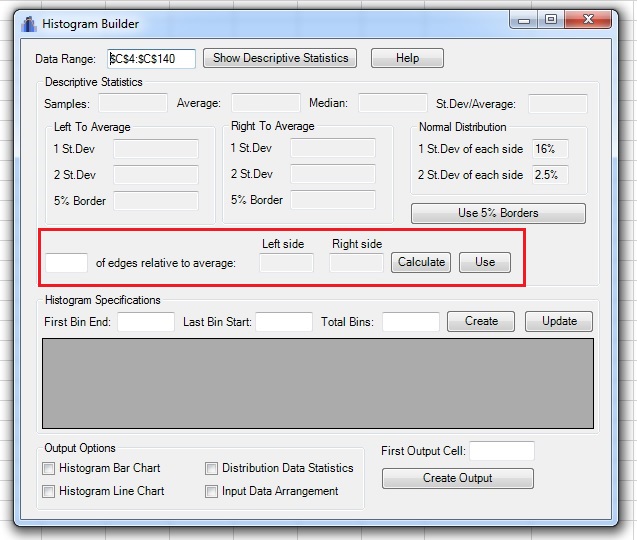
5. You can use the edges calculator to determine the edges of the histogram. Input the percentage of samples you want to be included in the most left and most right bins and click on the “Calculate” button. Histogram Builder will calculate and show the edges of the bins according to your selection. The calculation is based on distance from the average, so the edges might not be parallel. If you want to use those borders, click on “Use” button:
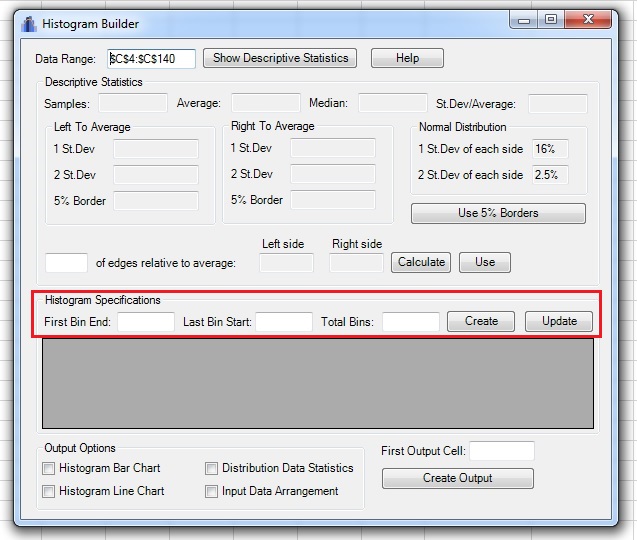
6. Under Histogram Specifications, enter the borders of the bins on the edges and total number of bins. Note that the default of Histogram Builder is a histogram with 10 bins, and that the bins would be evenly distributed between the selected borders. Click on the “Create”button in order to view the data of the histogram:
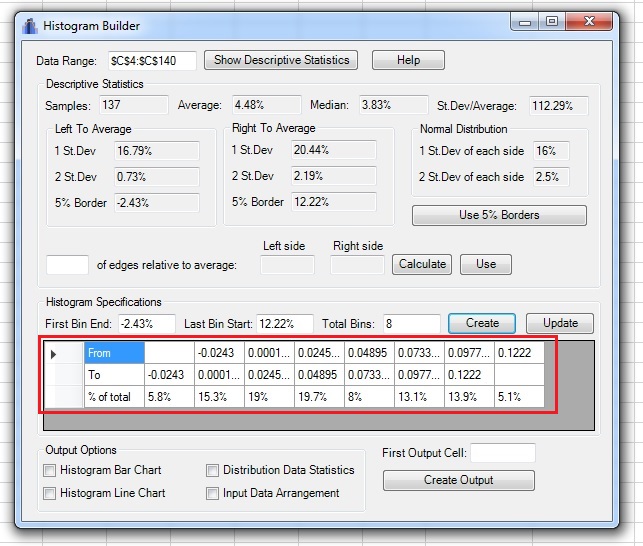
7. You can see the ranges of the bins of the histogram and the ratio of samples in each bin compared to the total sample. If you want, you can change the borders of the bins using one rule: the “From” of the current bin must be the same as the “To” of the previous bin. If you made changes to the borders, click on the “Update” button to update the histogram:
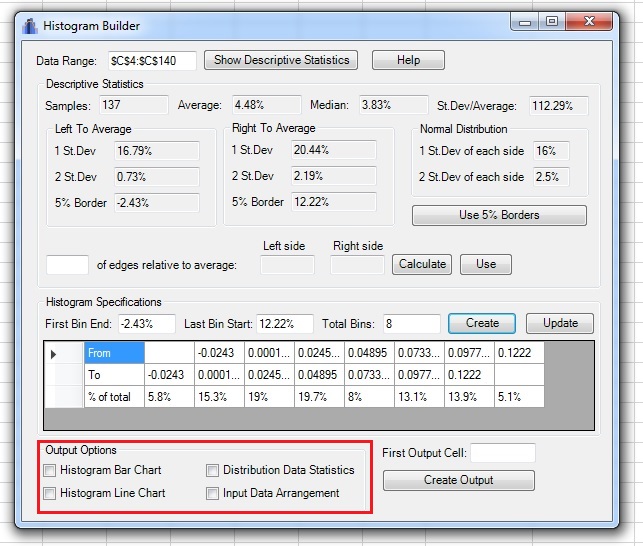
8. Choose the desired output. Histogram Builder will export the data found in the Histogram Specifications table and the additional options which you may select:
- Histogram Bar Chart will output a bar chart of the histogram.
- Histogram Line Chart will output a line chart of the histogram.
- Distribution Data Statistics will compute the average of samples in each bin
- Input Data Arrangement will create a list of the samples in each bin
9. Select the first output cell by clicking on the First Output Cell field, clicking on the cell in the spreadsheet and returning to the Histogram Builder window.
Note: If the range input field is not empty, you need to delete existing text before selecting a new range in the spreadsheet.
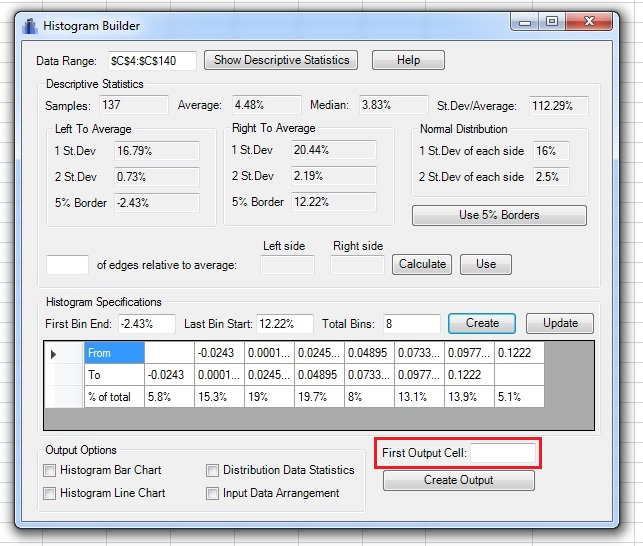
10. Click on the “Create Output” button. If the output range in the spreadsheet is not empty, Histogram Builder will ask if you want to paste the data anyway.
