LTV, or Loan-to-Value ratio, serves as a fundamental metric in various industries, particularly in real estate. The acronym breaks down to “Loan” and “Value,” reflecting the ratio between the loan amount and the asset’s value. For instance, if a $60 loan is extended to an asset valued at $100, the LTV ratio would be 60%. This implies that if the asset’s value drops by more than 40%, the loan cannot be fully recovered. Similarly, for equity holders in the asset, a decrease exceeding 40% in asset value results in a loss of all equity.
Although straightforward, LTV can be deceptive, especially when dealing with asset value which is a derivative of other variables. In such cases, it’s essential to consider the impact of key variables driving the asset’s value. While LTV can still be calculated, a sensitivity table analyzing the LTV’s response to variations in the primary influencing factors provides more insightful data. A sensitivity table will illustrate how changes in variables such as NOI (Net Operating Income) and Cap Rate affect the asset’s value, offering a comprehensive understanding of potential fluctuations in LTV.
Let’s consider an example:
We’re contemplating extending loans to two multifamily assets, each valued at $100. Both assets yield a NOI of $5, and the appraised cap rate stands at 5%. Typically, we cap our loans at an LTV of 60%, leading us to consider lending $60 to each asset. However, recognizing that asset value hinges on factors like NOI and cap rates, we opt to construct a sensitivity table.
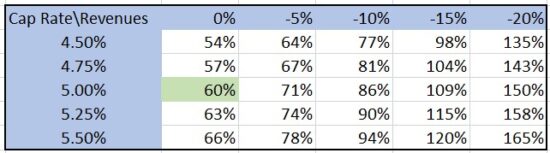
The ensuing analysis yields the following insights for Asset 1:
And for Asset 2:
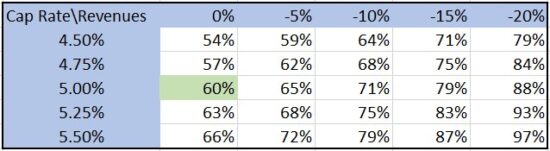
Asset 1, situated in a high property tax state and partially financed through a ground lease, exhibits significantly higher expenses as a percentage of revenues compared to Asset 2. As a result, Asset 1 experiences a bigger shift in NOI when revenues change by the same amount. The sensitivity table shows that a 10% decline in revenues escalates the LTV to 86% for Asset 1, whereas for Asset 2, the same revenue shift leads to an LTV of 71%.
Despite both assets exhibiting the same LTV initially, the loan for Asset 1 appears riskier post-sensitivity analysis. Armed with this knowledge, we can opt to adjust the loan amount for Asset 1 or negotiate a higher interest rate for a $60 loan. Equity stakeholders should similarly scrutinize their risk exposure through analogous calculations.