This is the CAGR Calculator tutorial.
You can watch the tutorial video, read the step by step text tutorial or go through the step by step screenshots tutorial:
To follow along, you can download the Excel file used in this tutorial
Step by Step Text Tutorial:
1. In Excel, select a range of data. The first row must contain the periods and the first column must contain the names of the accounts or of the data series.
Periods input rules:
- Quarter periods. Example: Q1 2016, 3Q 2016
- Half Year periods: Example: H1 2016
- Year periods. Example: 2016
2. Click on the CAGR Calc icon in the ADD-INS toolbar. The CAGR Calculator window will open and you will see the selected data range coordinates in the Data Range field.
3. Click on the “Update Input” button and a list of the account names will appear in the Select Accounts section.
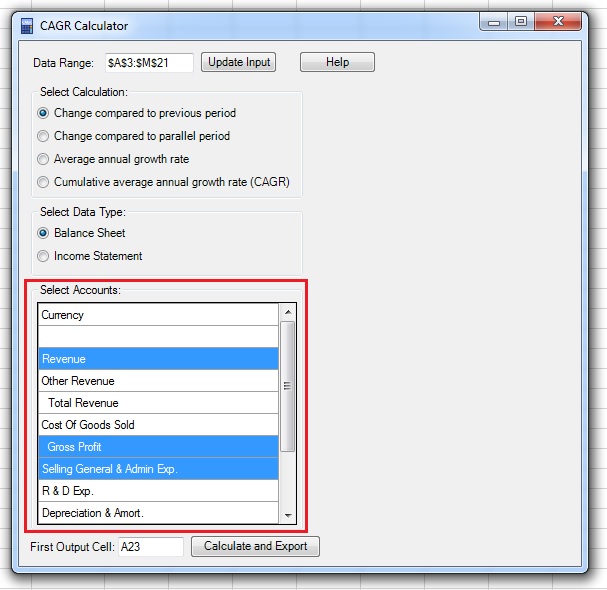
4. Select the relevant accounts from the Select Accounts section. By default, CAGR Calculator will select all the accounts. You can make a different selection by pressing the “Ctrl” keyboard key and clicking on the required accounts, just like any multi selection in Windows or Excel.
5. Select the calculation type you wish to perform in the Select Calculation section:
- Change compared to previous period: The export will be the % change of each period compared to its previous period, for the whole period range.
- Change compared to parallel period: The export will be the % change of each period compared to its parallel period, for the whole period range.
- Average annual growth rate: The export will be the average annual change rate between periods according to your selection.
- Cumulative average annual growth rate (CAGR): The export will be the cumulative average annual change rate between periods according to your selection.
If you selected one of the first 2 options, skip action items 6 and 7 and continue from action item 8.
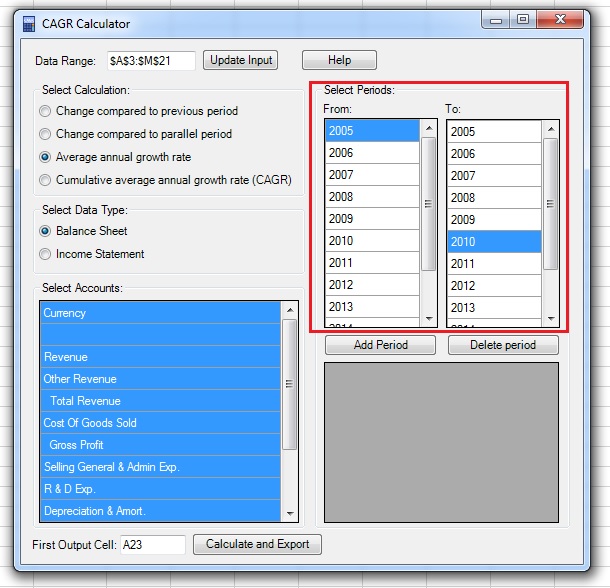
6. Upon selection of the Average annual growth rate or CAGR, new selection menus will appear in the left side of the window. Use the “From” and “To” lists in the Select Period section to select the starting end ending periods of the required calculation, and press on the “Add Period” button.
7. Upon clicking on the “Add Period” button your selection will appear in the bottom data table. You can add as many periods as you like and also use the “Delete Period” button to remove periods from the list.
8. Select the data type in the Select Data Type section:
- “Balance Sheet”: the data will stay the same as the original.
- "Income Statement": the data will be adjusted to its annual rate. For example, quarterly data will be multiplied by a factor of 4.
9. Select the first output cell by clicking on the First Output Cell field, clicking on the cell in the spreadsheet and returning to the CAGR Calculator window.
Note: If the range input field is not empty, you need to delete existing text before selecting a new range in the spreadsheet.
10. Click on the “Calculate and Export” button. If the output range in the spreadsheet is not empty, the application will ask if you want to paste the data anyway.
Note that the output of CAGR Calculator includes the references to the appropriate cells in the spreadsheet and not the results of the calculations, so changes to the data in the input range will change the calculations.
Step by Step Screenshots Tutorial:
1. In Excel, select a range of data. The first row must contain the periods and the first column must contain the names of the accounts or of the data series.
Periods input rules:
- Quarter periods. Example: Q1 2016, 3Q 2016
- Half Year periods: Example: H1 2016
- Year periods. Example: 2016
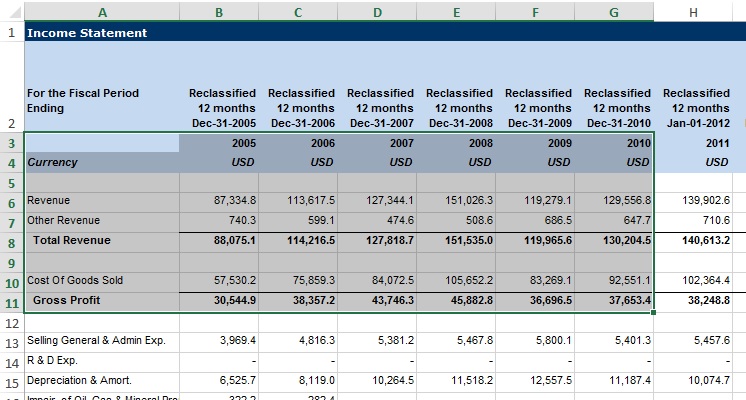
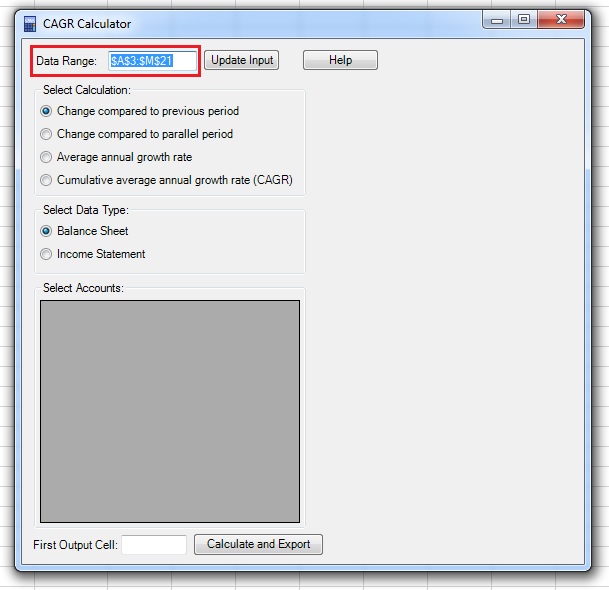
2. Click on the CAGR Calc icon in the ADD-INS toolbar. The CAGR Calculator window will open and you will see the selected data range coordinates in the Data Range field:
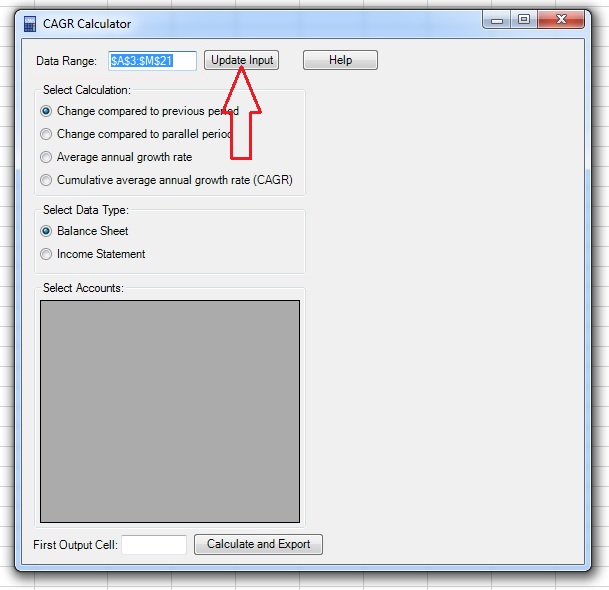
3. Click on the “Update Input” button and a list of the account names will appear in the Select Accounts section:
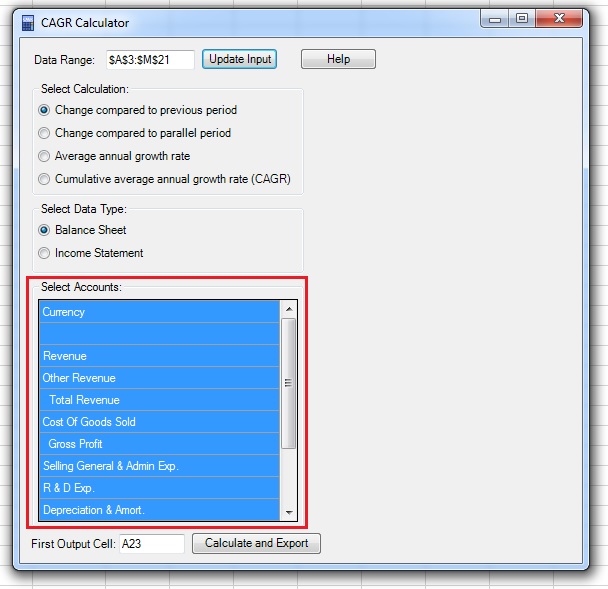
4. Select the relevant accounts from the Select Accounts section. By default, CAGR Calculator will select all the accounts. You can make a different selection by pressing the “Ctrl” keyboard key and clicking on the required accounts, just like any multi selection in Windows or Excel.
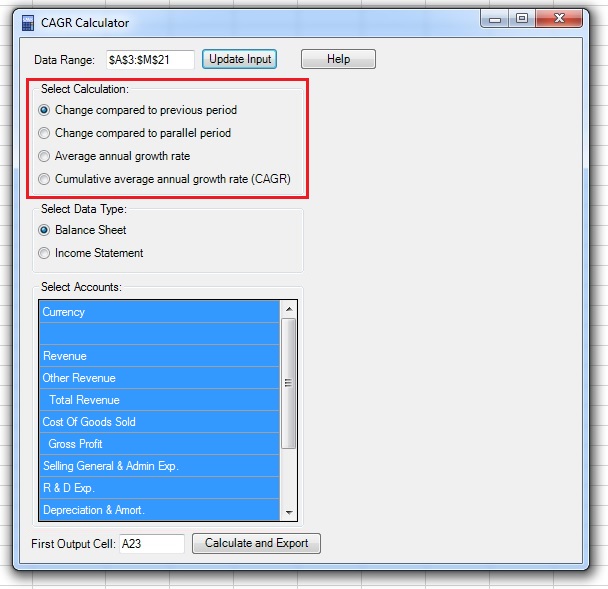
5. Select the calculation type you wish to perform in the Select Calculation section:
- Change compared to previous period: The export will be the % change of each period compared to its previous period, for the whole period range.
- Change compared to parallel period: The export will be the % change of each period compared to its parallel period, for the whole period range.
- Average annual growth rate: The export will be the average annual change rate between periods according to your selection.
- Cumulative average annual growth rate (CAGR): The export will be the cumulative average annual change rate between periods according to your selection.
If you selected one of the first 2 options, skip action items 6 and 7 and continue from action item 8.
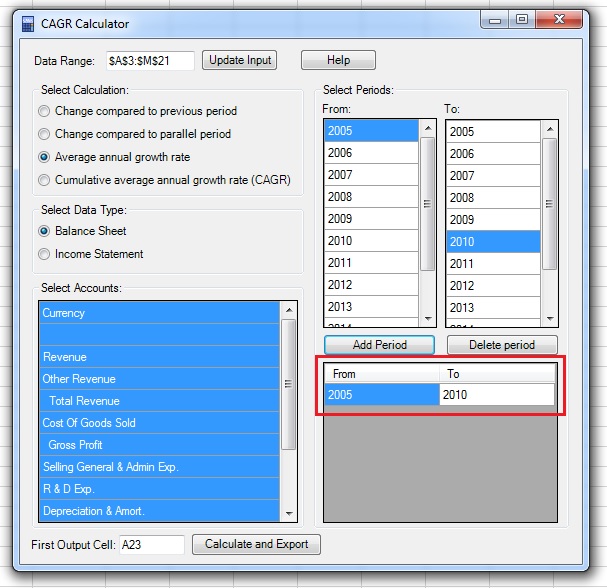
6. Upon selection of the Average annual growth rate or CAGR, new selection menus will appear in the right side of the window. Use the “From” and “To” lists in the Select Period section to select the starting end ending periods of the required calculation, and press on the “Add Period” button:
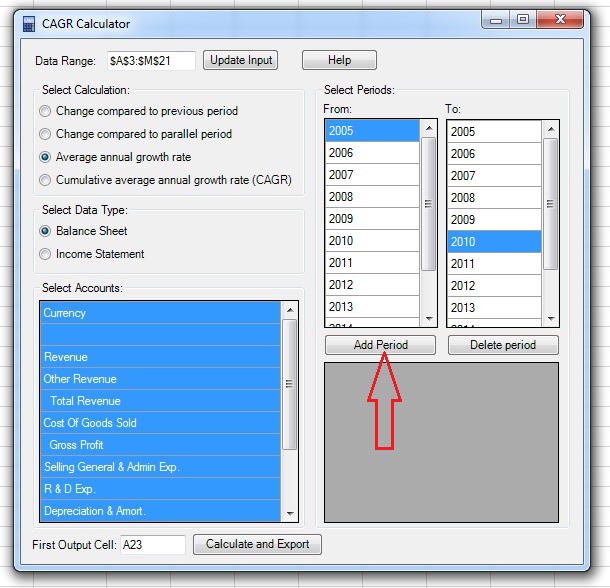
7. Upon clicking on the “Add Period” button your selection will appear in the bottom data table. You can add as many periods as you like and also use the “Delete Period” button to remove periods from the list.
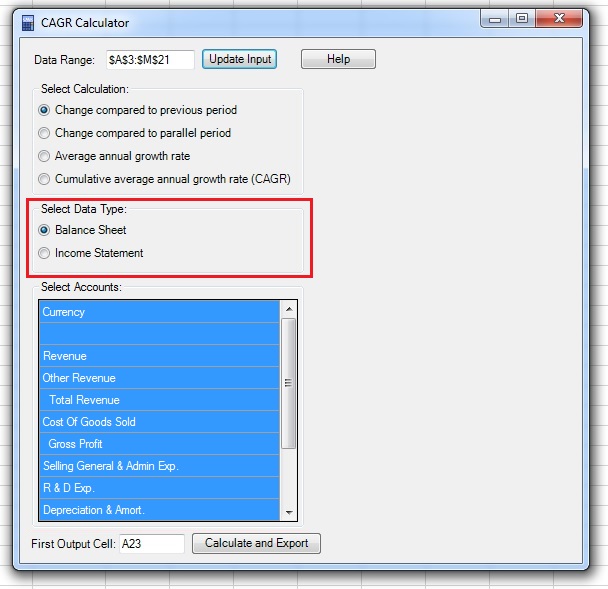
8. Select the data type in the Select Data Type section:
- “Balance Sheet”: the data will stay the same as the original.
- "Income Statement": the data will be adjusted to its annual rate. For example, quarterly data will be multiplied by a factor of 4.
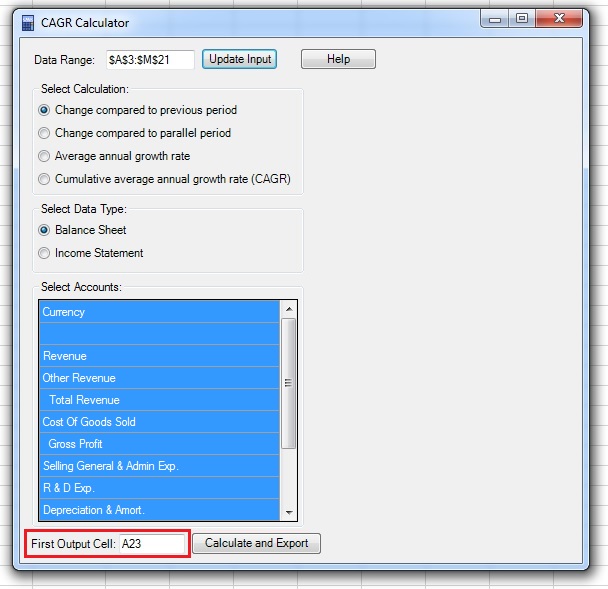
9. Select the first output cell by clicking on the First Output Cell field, clicking on the cell in the spreadsheet and returning to the CAGR Calculator window:
Note: If the range input field is not empty, you need to delete existing text before selecting a new range in the spreadsheet.
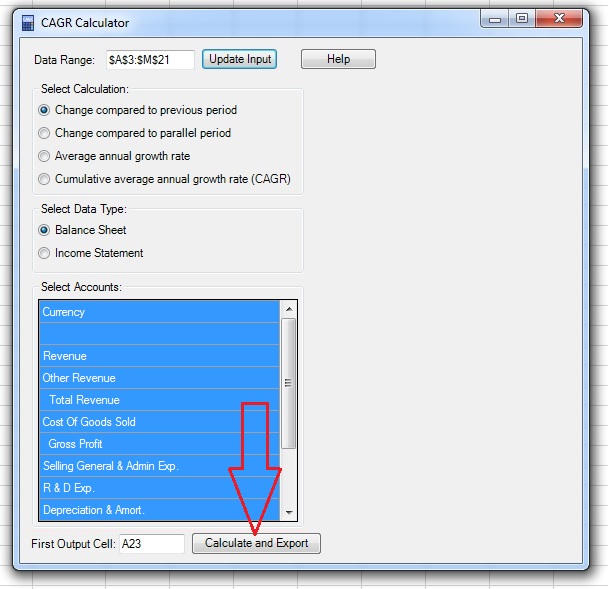
10. Click on the “Calculate and Export” button. If the output range in the spreadsheet is not empty, the application will ask if you want to paste the data anyway.
Note that the output of CAGR Calculator includes the references to the appropriate cells in the spreadsheet and not the results of the calculations, so changes to the data in the input range will change the calculations.

