Cost of Gross Sales Forecasting
The cost of gross sales includes all the direct costs associated with the creation of the products or services sold. In manufacturing firms, those are the costs of the raw material used in production, the labor costs of the factory employees, the depreciation of the machinery and etc. For retailers, it will mostly include the costs related to the purchase of merchandise sold and often store rent and other occupancy costs. We can see that the cost of gross sales can be divided into two categories:
- Fixed costs: costs that will remain relatively stable upon a change in quantity sold, like store rent, since rent is usually not very dependent on the revenues of the store.
- Variable costs: costs that will change as quantity sold is changing, for example, raw materials used in the manufacturing process. The more units you manufacture, the more raw materials you will need.
If we have data regarding the fixed and variable costs distribution of the cost of gross sales, we can model those two costs categories differently. Fixed costs will usually change upon a significant change in expected revenues- for example, the company decides to build additional factory for its products, or close stores in unprofitable locations. Variable costs are forecasted very much like the process of revenue forecasting, quantity multiplied by price. As revenues forecasting is executed before the Cost of Gross Sales forecast, the quantity forecast should already be available, since the quantity of variable costs should be the same as the quantity of products/services provided. What is left to do is to forecast the price changes in the costs of the quantity sold, the same way we forecasted those changes in the revenue forecasting process.
If we cannot distinguish between fixed and variable costs, we will compute historical gross profit margins (gross profit margins divided by revenues). Then, we will try to understand the reasons for changes of those historical margins. Did they decreased because the price of the main row material used by the company increased and the company could not transfer this increase to its customers? Or did gross profit margins increased due to reorganization and improvement of the manufacturing process? It is important to understand if the margin in the most recent financial reports is extraordinary or is actually close to the representative gross margin which we can expect in the future.
Of course, a comparison to other companies in the industry is vital. It can show if the gross margin of companies in the industry is similar, and if the trend of change in gross margins is the same. For example, lest try to analyze 4 retailers in the Apparel & Accessories industry:

We can see that the gross margins are roughly similar, with an average in the range of 39% to 43%. Also, there is a relatively low variability over the years with a standard deviation to average ratios in the range of 9% to 14% only. According to this, we can deduce that gross margins of Apparel & Accessories retailers don't change much due to the competitive nature of the industry. The decrease in manufacturing and raw materials costs very quickly translates to merchandise price decrease.
Another type of analysis we can perform is to view the distribution of gross profit margins of the analyzed company over time, or compare it to the industry. A distribution histogram is a much better tool compared to relying only on the average and the median, and you can easily create it using the Histogram Builder Excel Add-in which is part of the Analystix Tools package. Following is the distribution of the gross profit margins of AEO (American Eagle Outfitters):

In this case, the histogram reinforces our conclusion regarding the low variability in gross margins over the years, as we see that in 38% of the years in the last 21 years period, the gross profit margin was close to its average (42.4%) in this period. We can also see that in approximately 19% of the sample (4 years), the gross profit margin of AEO was farther than the average by more than 10%. We will also note the downward trend in recent years, as two of the farthest low samples are the most recent ones, and maybe conclude that the long term average is not a good representative of the future.
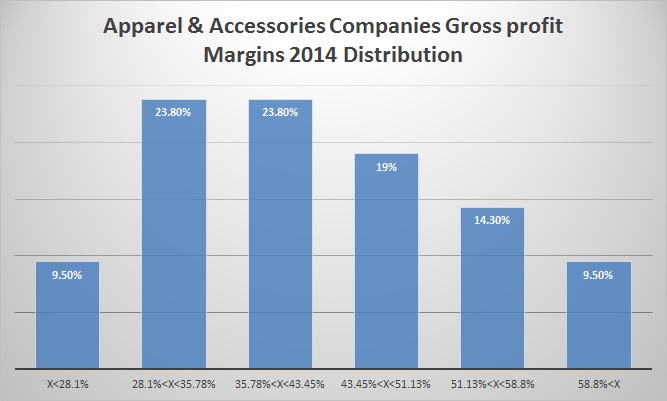
Another use of the distribution histogram is to analyze the company compared to its peers. Following is the distribution histogram of the gross profit margins of 21 companies in the worldwide Apparel & Accessories industry in 2014:

Here, we can see that although the average and the median were 42.76% and 42.5%, respectively, the actual distribution tells a bit different story as most of the samples were actually bellow those statistics. The conclusion is that although the gross profit margin of AEO in 2014 was 35.1%, below the industry average, it was actually not that different compared to most companies in the industry.

