This is the Data Arranger tutorial.
You can watch the tutorial video, read the step by step text tutorial or go through the step by step screenshots tutorial:
To follow along, you can download the Excel file used in this tutorial
Step by Step Text Tutorial:
1. In Excel, select a range of data. It can be a range of two rows/columns where the first row/column contains the periods and the second numerical data, or a square range where the first row contains months and the first column contains years.
Date/Period Input Rules:
- Dates: the application will use only the month and year of the date. Example: 25/12/2016 will be considered as December 2016.
- Quarter periods. Example: Q1 2016 (January-March 2016), 3Q 2016 (January-September 2016).
- Half Year periods: Example: H1 2016 (January-June 2016).
- Year periods: 2016 (January-December 2016).
2. Click on the Data Arranger icon in the ADD-INS toolbar. The Data Arranger window will open and you will see the selected data range coordinates in the Data Range field.
3. Select the data type of the input in the Data Type- Input section- average data or end of period data.
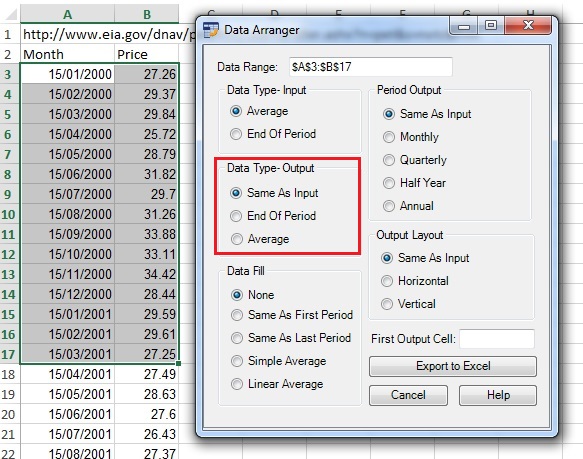
4. Select the data type of the output in the Data Type- Output section- average data or end of period data.
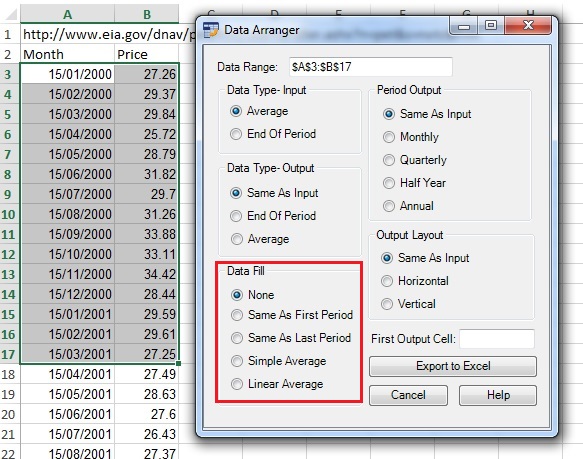
5. Select the data fill method in the Data Fill section (relevant to data series with missing data entries).
The Data Fill function can fill empty data according to user selection:
- Same as first period: each empty data period will be equal to the first existing number in the previous period.
- Same as last period: each empty data period will be equal to the first existing number after the period.
- Simple average: each empty data period will be equal to the average of the first existing number before and after the period.
- Linear average: the application will compute a linear equation between the first before and after existing numbers and fill according to the number of empty data periods.
6. Select the output periods in the Period Output section.
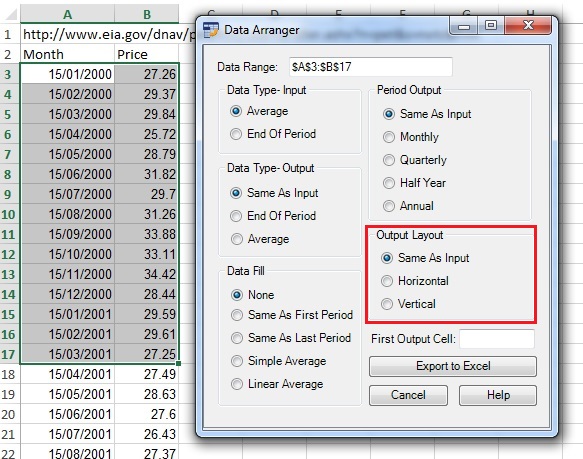
7. Select the output layout in the Output Layout section.
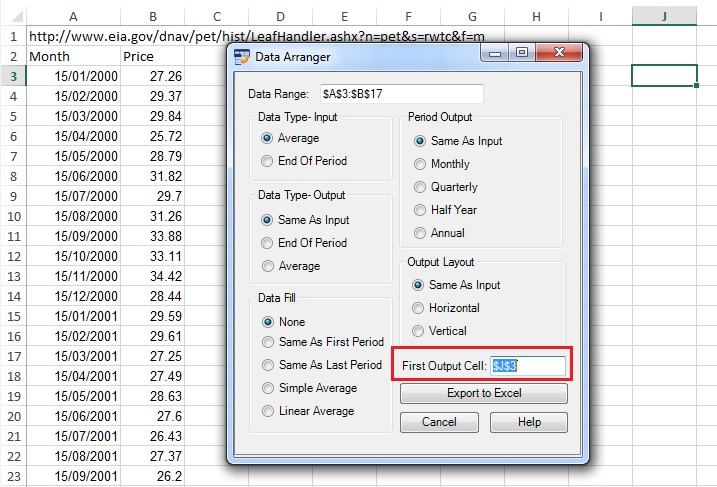
8. Select the first output cell by clicking on the First Output Cell field, clicking on the cell in the spreadsheet and returning to the Data Arranger window.
Note: If the range input field is not empty, you need to delete existing text before selecting a new range in the spreadsheet.
9. Click on “Export to Excel” button. If the output range in the spreadsheet is not empty, Data Arranger will ask if you want to paste the data anyway.
Step by Step Screenshots Tutorial:
1. In Excel, select a range of data. It can be a range of two rows/columns where the first row/column contains the periods and the second numerical data, or a square range where the first row contains months and the first column contains years.
Date/Period Input Rules:
- Dates: the application will use only the month and year of the date. Example: 25/12/2016 will be considered as December 2016.
- Quarter periods. Example: Q1 2016 (January-March 2016), 3Q 2016 (January-September 2016).
- Half Year periods: Example: H1 2016 (January-June 2016).
- Year periods: 2016 (January-December 2016).
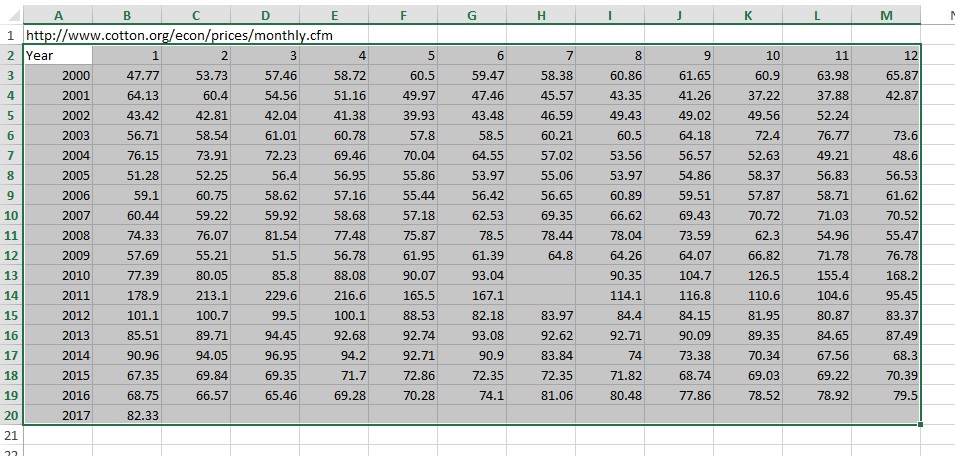
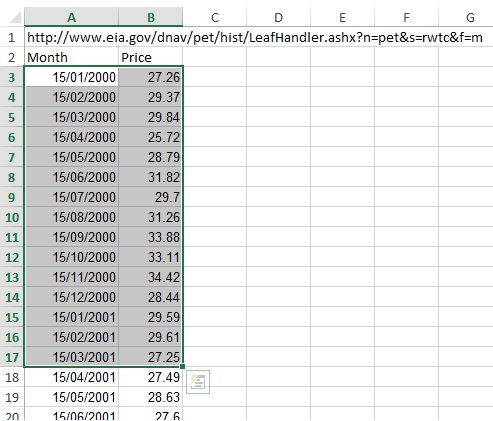
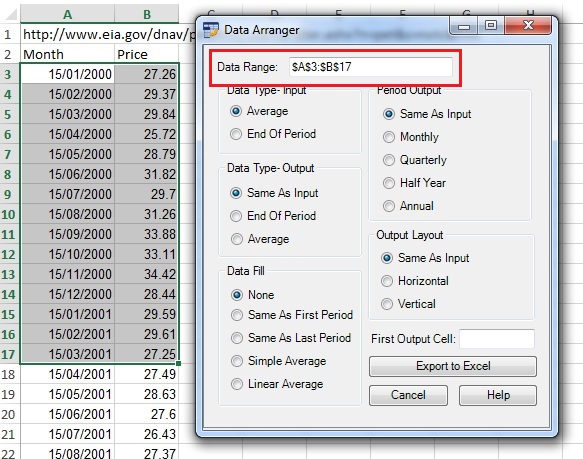
2. Click on the Data Arranger icon in the ADD-INS toolbar. The Data Arranger window will open and you will see the selected data range coordinates in the Data Range field:
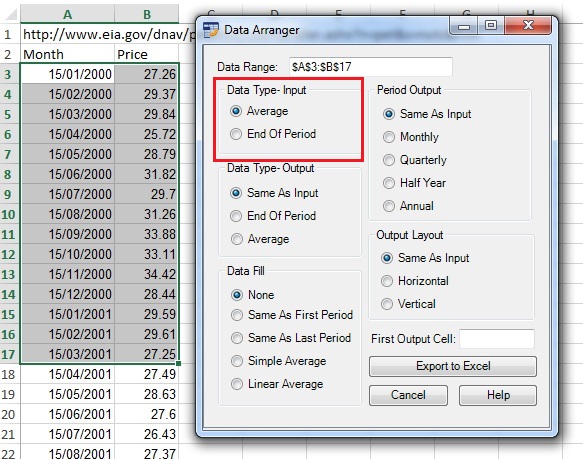
3. Select the data type of the input in the Data Type- Input section- average data or end of period data:
4. Select the data type of the output in the Data Type- Output section- average data or end of period data:
5. Select the data fill method in the Data Fill section (relevant to data series with missing data entries).
The Data Fill function can fill empty data according to user selection:
- Same as first period: each empty data period will be equal to the first existing number in the previous period.
- Same as last period: each empty data period will be equal to the first existing number after the period.
- Simple average: each empty data period will be equal to the average of the first existing number before and after the period.
- Linear average: the application will compute a linear equation between the first before and after existing numbers and fill according to the number of empty data periods.
6. Select the output periods in the Period Output section:

7. Select the output layout in the Output Layout section:
8. Select the first output cell by clicking on the First Output Cell field, clicking on the cell in the spreadsheet and returning to the Data Arranger window.
Note: If the range input field is not empty, you need to delete existing text before selecting a new range in the spreadsheet.
9. Click on “Export to Excel” button. If the output range in the spreadsheet is not empty, Data Arranger will ask if you want to paste the data anyway.


