Parameters used in analyzing apparel & accessories retailers:
Average sales per store: Total sales in a given period divided by the average number of stores in this period. Used to analyze the change in sales which is not attributed to change in the number of stores operated by the company.
Average sales per square foot: Total sales in a given period divided by the average square foot of store space in this period. Used to analyze the change in sales which is not attributed to change in the selling space operated by the company.
Same Stores Sales: The change in sales of stores which existed in both the periods compared.
Shrinkage Losses: Losses due to theft and errors. Calculated as a ratio of Shrinkage Losses to Total Sales and helps analyze the efficiency of the company.
Store Openings to Store Closings ratio: The ratio of store openings to store closes in a given period. Used to analyze the pattern of growth and the effectiveness of store openings over multiple periods.
Inventory Turnover: Total sales in a given period divided by the average inventory in this period. Used to analyze the ability of the company to sell its products efficiently.
Average Unit Retail (AUR): The average price of an item sold. The product of AUR and units per transaction is the average basket.
Average Basket: The average revenue from a transaction.
Parameters used in a cash flow forecast:
Revenues from Sales:
The revenues from store sales are a product of the quantity of transactions and the average basket value. The quantity of transactions is dependent on the number of stores and the average feet per store while the average basket value is a product of the AUR and units per transaction. Following is the description of the sales from stores model:
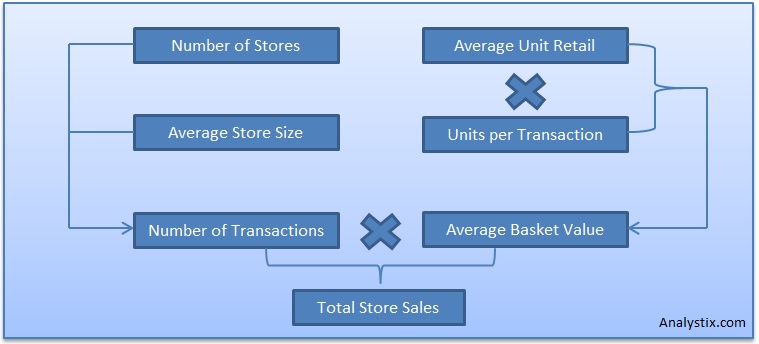
The number of stores and the average store size is usually information provided by the company for each reported period. In the apparel industry the average store size usually doesn’t change much because part of the branding is the size of the stores which is also affected by the segment- for example, low cost brands tend to use big stores. The change in the number of stores is the number of stores opened minus the number of stores closed. Stores closed will decrease revenues but usually increase margins because the main reason for closing those stores is low margins or losses. New stores will increase revenues but not immediately since new stores need time to reach maturity which is different across market segments and brands. Because of that new stores might decrease margins until reaching maturity since most of the costs of operation are present from day one but the revenues are low at the start.
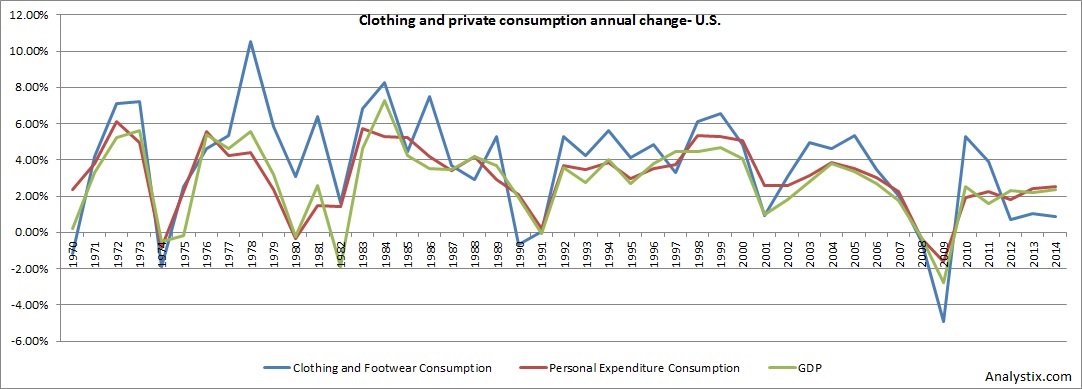
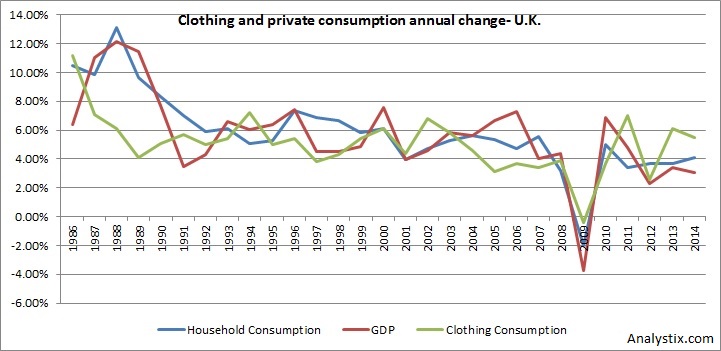
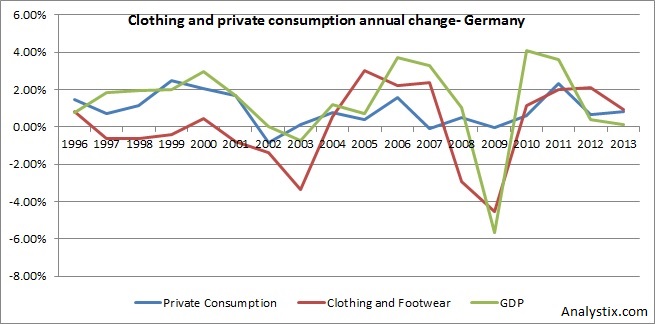
The change in same store sales is a function of price and quantity. The quantity, which is the number of transactions and number of units per transaction in a given economy can be estimated using the real change in Clothing and Footwear consumption. In some countries were is a strong relationship between change in Personal Consumption and GDP to Clothing and Footwear consumption while in others this is not the case. Following is the correlation coefficient of annual changes in Clothing and Footwear consumption and in Personal Consumption, in constant prices, in several developed countries (using samples of 18 to 24 years):
| Country | Correlation |
| Canada | 79.3% |
| France | 70.2% |
| Germany | 30.3% |
| Japan | 19.4% |
| UK | 43.4% |
| US | 88.6% |
Following are charts that show the change in Clothing and Footwear consumption, Personal Consumption and GDP in several countries (click to enlarge):
| United States | United Kingdom | Germany | Japan |
 |
 |
 |
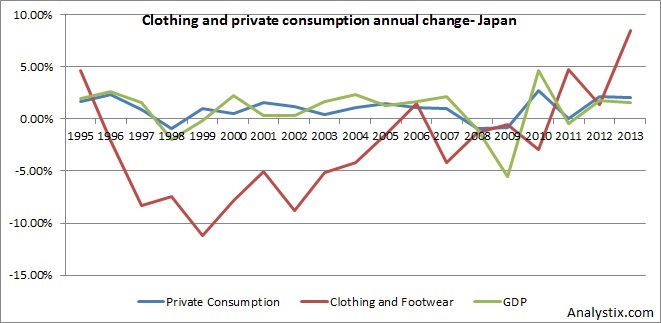 |
Those charts show that an individual regression should be assessed for each country of operation.
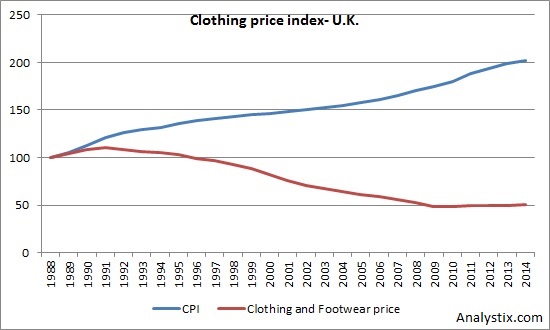
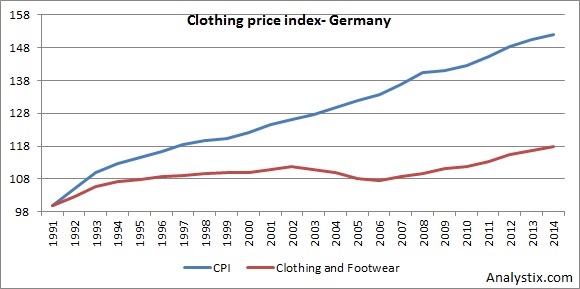
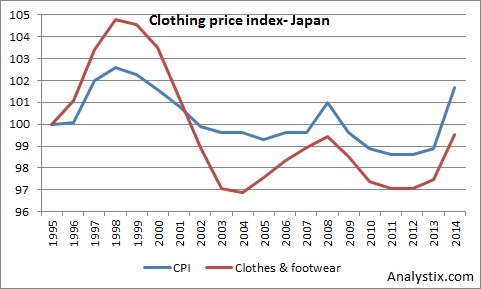
The average basket value is a function of AUR and units per transaction. The change in AUR is mostly dependent on the price of the merchandise. In most developed countries, the change in the price index of Clothing and Footwear was much lower than the CPI and in some countries even negative due to lower manufacturing costs as manufacturing transferred to developing countries.
Following are charts that show the Clothing and Footwear price index and CPI in several countries (click to enlarge):
| United States | United Kingdom | Germany | Japan |
 |
 |
 |
 |
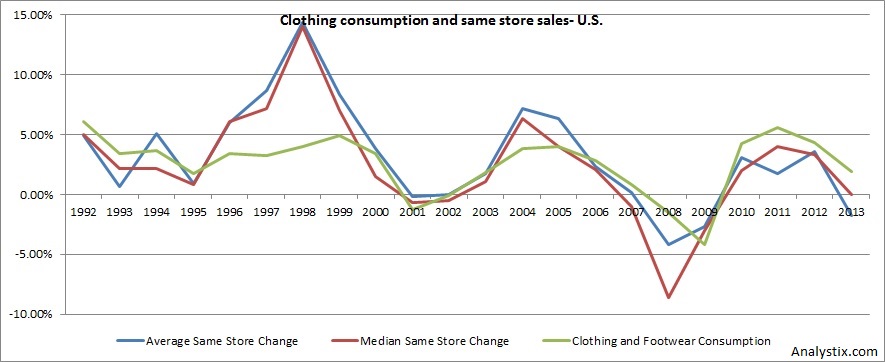
The nominal change in clothing consumption, i.e. the product of the change in the real consumption and price in a particular country, can describe the average change in same store sales in this country. I used same store sales change data for a sample of 13 of the largest apparel & accessories retailers in the U.S. for the years 1992-2013. The correlation between the average and the median change in same store sales of the sample with the nominal change in clothing consumption in the U.S. was 0.66 and 0.71, respectively. Following is a chart which shows the trend of those parameters during the sample period:
The basic revenue model of apparel & accessories retailers assumes a change in same store sales which is derived from anticipated changes in prices and consumption and sales from new stores according to anticipated break in period. The break in period can be estimated using a regression or with a simple model with break in period as the plug number, for example:
( Same Stores quantity + 0.5 * X * Number of new stores ) * Sales per Store = Revenue
Where X is the break in period in years. The plug number is multiplied by 0.5 because of the assumption that new stores were opened symmetrically during the year.
For another sales forecasting model which uses the cost of goods sold, inventory and gross margin, check the article Do Inventory and Gross Margin Data Improve Sales Forecasts for U.S. Public Retailers? by S. Kesavan, V. Gaur and A. Raman.
Many apparel & accessories retailers also sell products via a website with similar dynamics except the number of transactions which is not dependent on physical factors. The characteristics of store sales vs web sales in terms of growth and margin are different; therefore it is customary to model them separately.
Following is a summary of factors related to sales of apparel & accessories retailers:
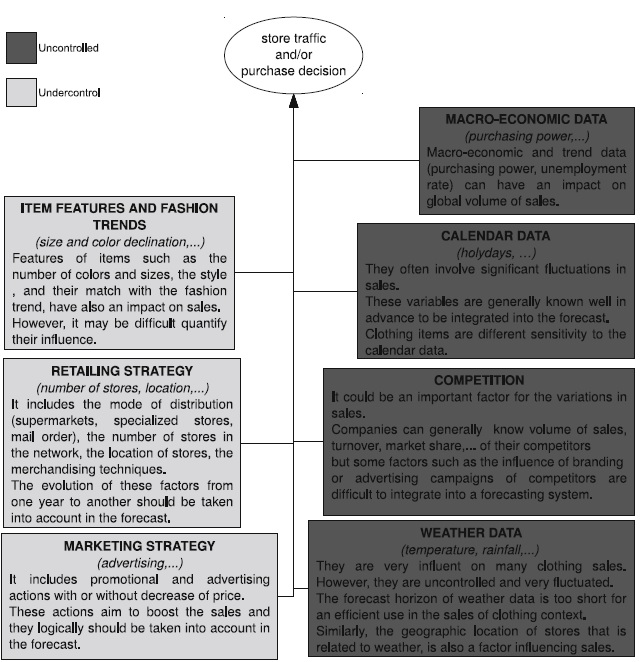
* from the article: Sales Forecasting in Apparel and Fashion Industry: A Review. S. Thomassey
Gross Profit
The cost of gross sales of apparel & accessories retailers usually includes the costs related to the purchase and/or manufacturing of the merchandise sold, merchandise markdowns and shrinkage losses and in some companies also the occupancy costs (rent, real estate taxes, etc.) and depreciation. It is hard to compare between companies since some include the occupancy costs and the depreciation and other do not. My opinion is that COGS should include only costs which were directly caused by sales, meaning only costs related to the merchandise sold. That way you can assume a certain gross profit margin and deal with the occupancy costs, which are related to the number and size of stores, separately.
Since some companies produce their own merchandise, some purchase from manufacturers or other brands and some doing both, the COGS may look different. Companies which purchase merchandise from other companies will show the buying and distribution costs (and sometime royalties) while manufacturers will also show the cost of raw materials and workforce. Most companies purchase merchandise/raw materials from other countries thus creating an exposure to exchange rate fluctuations. Other changes in gross margins may be caused by promotions executed by the company, change in the percentage of sales of own brands (own brand items usually enjoy higher margins relative to sales of other brands) and markdowns of inventory. Also, were are several ways to manage inventory- some companies purchase or manufacture most of the collection in advance while others, like Zara, follow a fast fashion system, produce most of the collection during the season and respond to actual demand.
Following are the gross margins of some of the largest Apparel & Accessories Retailers in the last 20 years:
| Company | Average- All | ST.Dev/Average- All | Average 2004-2014 | ST.Dev/Average 2004-2014 | 1991 | 1992 | 1993 | 1994 | 1995 | 1996 | 1997 | 1998 | 1999 | 2000 | 2001 | 2002 | 2003 | 2004 | 2005 | 2006 | 2007 | 2008 | 2009 | 2010 | 2011 | 2012 | 2013 | 2014 |
|---|---|---|---|---|---|---|---|---|---|---|---|---|---|---|---|---|---|---|---|---|---|---|---|---|---|---|---|---|
| TJX | 24.74% | 8.11% | 25.90% | 8.13% | 23.20% | 24.30% | 25.20% | 22.40% | 20.90% | 22.20% | 23.10% | 25.00% | 25.10% | 24.90% | 24.10% | 24.20% | 24.20% | 23.50% | 23.40% | 24.10% | 24.20% | 24.00% | 26.20% | 26.80% | 27.30% | 28.40% | 28.50% | 28.50% |
| GPS | 39.48% | 10.87% | 41.57% | 12.60% | 37.70% | 33.90% | 35.60% | 36.80% | 35.80% | 37.80% | 38.20% | 41.20% | 41.70% | 37.10% | 36.50% | 40.40% | 37.60% | 39.20% | 36.60% | 35.50% | 36.10% | 37.40% | 48.10% | 47.80% | 44.40% | 47.20% | 46.80% | 38.20% |
| ROST | 27.18% | 11.88% | 26.37% | 15.75% | 29.10% | 28.70% | 27.30% | 27.10% | 27.60% | 29.30% | 30.20% | 30.60% | 31.00% | 25.50% | 24.80% | 25.50% | 25.50% | 22.40% | 22.00% | 22.40% | 22.70% | 23.50% | 25.80% | 27.10% | 31.90% | 32.00% | 32.20% | 28.10% |
| ANF | 64.40% | 3.37% | 64.49% | 3.49% | 27.50% | 34.30% | 33.80% | 36.90% | 38.50% | 41.10% | 43.60% | 41.10% | 47.30% | 41.00% | 63.40% | 66.30% | 66.40% | 66.50% | 67.20% | 66.90% | 64.30% | 63.90% | 61.30% | 62.40% | 62.50% | 61.70% | ||
| AEO | 41.95% | 14.01% | 41.97% | 14.45% | 29.40% | 44.10% | 43.00% | 38.40% | 43.50% | 45.80% | 50.00% | 52.10% | 39.80% | 39.80% | 39.10% | 38.20% | 54.10% | 46.40% | 47.90% | 46.50% | 40.60% | 39.90% | 40.10% | 36.60% | 40% | 34.50% | 35.10% | |
| CHS | 57.62% | 5.94% | 56.49% | 5.21% | 57.10% | 59.80% | 63.90% | 62.10% | 48.90% | 58.30% | 55.80% | 58.50% | 58.00% | 58.10% | 59.20% | 60.50% | 61.20% | 61.30% | 61.00% | 58.90% | 56.50% | 51.70% | 56.00% | 56.00% | 55.80% | 56.20% | 54.70% | 53.30% |
| ANN | 50.15% | 7.99% | 52.72% | 4.37% | 46.50% | 43.50% | 45.80% | 45.60% | 41.80% | 44.40% | 47.20% | 50.00% | 50.50% | 49.80% | 50.10% | 54.10% | 54.50% | 51.10% | 50.90% | 53.60% | 52.20% | 48.00% | 54.30% | 55.70% | 54.60% | 54.80% | 53.80% | 50.90% |
| ARO | 36.70% | 13.14% | 36.85% | 14.81% | 34.90% | 36.00% | 37.60% | 39.30% | 36.10% | 38.20% | 40.90% | 40.90% | 43.80% | 42.90% | 33.30% | 32.90% | 27.10% | 29.90% | ||||||||||
| PLCE | 38.76% | 8.47% | 39.20% | 5.34% | 31.20% | 31.60% | 37.30% | 35.80% | 41.30% | 42.70% | 42.20% | 42.50% | 38.00% | 40.20% | 39.40% | 39.50% | 43.40% | 39.20% | 41.20% | 40.10% | 39.40% | 38.40% | 38.20% | 37.10% | 35.30% | |||
| SSI | 28.87% | 6.35% | 28.17% | 2.97% | 30.90% | 31.40% | 31.30% | 31.40% | 31.90% | 28.40% | 26.10% | 25.00% | 30.20% | 30.10% | 28.60% | 28.90% | 29.10% | 29.30% | 28.70% | 27.00% | 27.30% | 28.60% | 27.10% | 28.20% | 28.30% | 27.40% | ||
| SMRT | 27.65% | 8.36% | 29.25% | 6.65% | 26.80% | 27.70% | 27.80% | 27.00% | 26.00% | 26.70% | 26.80% | 24.50% | 24.50% | 25.60% | 24.00% | 24.60% | 29.80% | 31.00% | 32.40% | 32.20% | 30.10% | 28.30% | 27.00% | 27.60% | 27.10% | 27.80% | 29.00% | 29.30% |
| BKE | 43.00% | 13.46% | 48.18% | 5.41% | 33.90% | 31.20% | 36.80% | 37.40% | 37.90% | 40.30% | 41.00% | 40.70% | 39.30% | 39.70% | 39.80% | 40.90% | 42.30% | 45.40% | 46.00% | 47.40% | 49.00% | 50.10% | 49.90% | 49.70% | 50.10% | 50.10% | 50.00% | |
| NWY | 34.35% | 12.43% | 36.13% | 6.74% | 24.90% | 28.10% | 30.50% | 34.30% | 32.40% | 40.60% | 37.80% | 35.80% | 36.20% | 33.60% | 33.80% | 37.30% | 38.20% | 37.40% | ||||||||||
| LB | 37.39% | 18.52% | 42.80% | 6.38% | 29.10% | 28.60% | 27.00% | 28.80% | 26.40% | 28.60% | 30.40% | 31.30% | 34.00% | 35.00% | 41.90% | 42.80% | 42.70% | 42.30% | 41.80% | 43.20% | 40.00% | 38.60% | 40.90% | 43.10% | 44.50% | 47.80% | 46.70% | 41.90% |
| URBN | 42.59% | 14.25% | 43.79% | 5.00% | 49.30% | 51.00% | 52.00% | 52.00% | 50.80% | 36.40% | 34.70% | 37.50% | 37.60% | 32.20% | 32.50% | 35.60% | 38.90% | 40.90% | 47.00% | 43.00% | 45.10% | 45.10% | 47.20% | 41.10% | 41.70% | 43.70% | 44.40% | 42.50% |
| PSUN | 37.55% | 15.07% | 42.50% | 6.76% | 30.30% | 30.20% | 28.40% | 31.60% | 33.80% | 33.70% | 34.90% | 33.50% | 32.10% | 34.50% | 35.70% | 47.60% | 46.00% | 44.70% | 43.70% | 38.60% | 41.30% | 39.70% | 39.20% | 41.50% | 41.70% | 43.50% | ||
| CATS:ITX | 55.01% | 6.56% | 57.63% | 2.70% | 49.90% | 50.40% | 51.40% | 51.10% | 51.90% | 51.50% | 50.10% | 55.40% | 56.10% | 56.20% | 56.60% | 56.80% | 57.00% | 59.20% | 59.30% | 59.70% | 59.30% | 58.30% | ||||||
| OM: HM | 57.09% | 7.30% | 60.00% | 2.69% | 50.70% | 50.90% | 52.80% | 50.50% | 51.60% | 55.10% | 56.10% | 57.20% | 59.00% | 59.40% | 61.00% | 61.50% | 61.60% | 62.90% | 60.10% | 59.40% | 59.10% | 58.80% | ||||||
| TSE: 9983 | 47.52% | 7.31% | 49.15% | 4.86% | 41.00% | 41.50% | 49.10% | 47.70% | 43.70% | 44.20% | 47.90% | 43.90% | 47.30% | 47.20% | 50.00% | 49.80% | 51.60% | 51.90% | 51.10% | 49.40% | 50.60% | |||||||
| JSE: MPC | 37.28% | 22.74% | 41.54% | 4.40% | 33.30% | 34.30% | 34.50% | 35.10% | 5.35% | 36.30% | 36.80% | 35.70% | 39.70% | 40.60% | 40.40% | 39.70% | 39.30% | 40.20% | 43.10% | 43.20% | 43.60% | 43.70% | 43.40% | |||||
| TSE: 2670 | 54.33% | 5.00% | 56.04% | 2.40% | 50.30% | 52.70% | 49.90% | 52.90% | 49.90% | 51.50% | 54.70% | 56.00% | 55.20% | 55.60% | 56.10% | 56.80% | 58.30% | 57.60% | 57.20% | 55.10% | 53.80% |
Download Apparel-Accessories-Retailers-Gross-Margins.xlsx
* The change in gross margins of ANF in 2003 is due to reclassification of the financial reports. The average and st.dev/average for ANF were computed from 2003.
The ratio of the standard deviation to average gross margin is very low for most of the companies, especially for the last 10 years period. Gross margins of apparel & accessories retailers don't change much due to the competitive nature of the industry. The decrease in manufacturing and raw materials costs very quickly translate to merchandise price decrease.
It is also important to analyze the trend of change in gross margins. Following is a chart of the average and median gross margins of U.S. based and international companies:
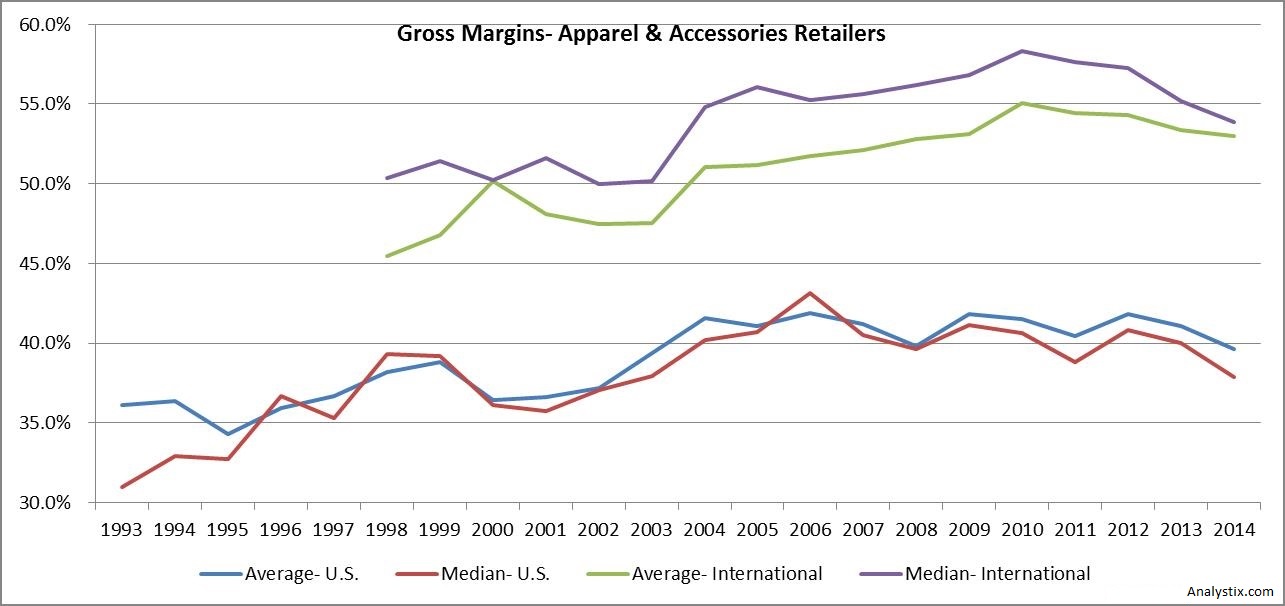
The chart is based on the data of the companies presented in the table above. The international average and median are based on a sample of 5 companies so we can’t deduce anything from the difference between U.S. based and international companies, but the trend over time seems to be the same. Gross margins of apparel & accessories retailers were rising from the early 90’s until 2005-2006. After 2006 gross margin growth stopped for U.S. based companies while international companies resumed showing rising margins until 2010. From 2012 both U.S. based and international companies show a decline in gross margins.
An examination of the gross margin trends of individual companies compared to the average show that 48% present a strong positive correlation, 19% moderate positive correlation and 5% (1 company) presented a moderate negative correlation. In total, it seems that most of the companies share the similar trend and deduction of individual performance from the average is possible, after the examination of the correlation.
Operating Income
Operating Expenses consist mostly of the expenses related to the operation of the stores- this includes salesperson, occupancy costs, electricity and so on. Some companies show occupancy costs as part of the gross cost of sales but since occupancy costs are much related to personnel costs I recommend modeling it together. That way, you can deduct the full expenses of maintaining a new store from day 1 but increasing the revenues and gross profits (which result from sales of merchandise) over time, until the store reaches maturity. Other operating costs are advertising and general and administrative.
Occupancy costs- mostly consist of rent and real estate taxes. Rent contracts are mostly based on a base price which increases by a specified percentage every year or a couple of years in order to neutralize inflation or a specified percentage of sales, the higher of the two. Contract length for retail properties are usually between 3 to 5 years. Most stores don’t reach the benchmark sales and pay according to the base price. In order to forecast the occupancy costs we need to estimate the costs of current stores and the costs of planned stores. Since most of the contracts pay according to a base price with small increases every period, the occupancy costs of the existing stores tends to increase with the inflation during the period of the contract. Planned stores and stores with expiring leases will adjust to market rent which is dependent on the commercial real estate market characteristics at the time of the contract renewal/signing. An estimation of the trend of the rent can be found in reports of commercial real estate service companies.
Personnel Costs- mostly consist of the wages of the salesperson in the stores. Total wages are mostly based on a base wage and a bonus which depends on sales. The base wages are usually low and may be affected by minimum wage increase.
Operating expenses also depend on the distribution of revenues to revenues from sales in the stores of the company or sales to other companies. Sales to the end consumer will have higher operating expenses but sales to a retailer will have low operating expenses but also lower gross margins.
Following are the operating expenses to revenues ratio of some of the largest Apparel & Accessories Retailers in the last 20 years:
| Company | Average- All | ST.Dev/Average- All | Average 2005-2014 | ST.Dev/Average 2005-2014 | 1991 | 1992 | 1993 | 1994 | 1995 | 1996 | 1997 | 1998 | 1999 | 2000 | 2001 | 2002 | 2003 | 2004 | 2005 | 2006 | 2007 | 2008 | 2009 | 2010 | 2011 | 2012 | 2013 | 2014 |
|---|---|---|---|---|---|---|---|---|---|---|---|---|---|---|---|---|---|---|---|---|---|---|---|---|---|---|---|---|
| TJX | 16.52% | 4.43% | 16.46% | 1.34% | 17.80% | 18.20% | 18.30% | 16.90% | 16.80% | 16.20% | 16.00% | 16.10% | 15.40% | 15.60% | 15.50% | 16.00% | 16.60% | 16.70% | 16.80% | 16.60% | 16.30% | 16.50% | 16.40% | 16.40% | 16.70% | 16.40% | 16.20% | 16.10% |
| GPS | 27.76% | 16.27% | 30.15% | 13.88% | 22.80% | 22.30% | 22.70% | 22.90% | 22.80% | 24.00% | 25.10% | 26.50% | 26.10% | 26.50% | 34.00% | 33.40% | 25.50% | 26.40% | 25.50% | 27.70% | 27.60% | 26.70% | 35.10% | 34.30% | 34.40% | 34.80% | 33.60% | 25.50% |
| ROST | 18.46% | 16.62% | 16.47% | 10.72% | 23.60% | 23.00% | 22.80% | 22.70% | 22.40% | 21.30% | 20.30% | 20.50% | 20.70% | 16.10% | 16.20% | 16.20% | 16.00% | 15.50% | 15.40% | 15.40% | 15.60% | 15.90% | 15.70% | 15.60% | 19.50% | 18.90% | 19.10% | 14.60% |
| ANF | 51.72% | 10.13% | 52.42% | 9.29% | 27.20% | 26.00% | 23.70% | 23.10% | 22.40% | 20.40% | 20.20% | 20.60% | 27.70% | 21.50% | 44.00% | 47.20% | 46.50% | 46.80% | 46.40% | 52.50% | 59.10% | 55.60% | 53.80% | 54.10% | 57.30% | 57.30% | ||
| AEO | 30.80% | 16.29% | 28.22% | 8.49% | 25.00% | 38.10% | 38.90% | 37.80% | 40.80% | 37.70% | 35.20% | 34.10% | 26.40% | 27.70% | 27.50% | 28.80% | 34.90% | 26.40% | 26.70% | 26.70% | 27.40% | 29.20% | 28.50% | 27.10% | 27.30% | 27.40% | 28.80% | |
| CHS | 46.26% | 11.68% | 45.84% | 8.45% | 47.30% | 46.00% | 46.90% | 52.50% | 62.90% | 52.60% | 49.30% | 44.40% | 42.00% | 40.60% | 41.40% | 40.30% | 39.90% | 40.30% | 39.70% | 42.80% | 49.40% | 52.70% | 48.80% | 46.70% | 45.40% | 44.90% | 46.40% | 47.10% |
| ANN | 42.75% | 11.79% | 46.99% | 5.54% | 36.60% | 34.40% | 35.60% | 33.90% | 38.30% | 37.70% | 40.80% | 39.60% | 39.20% | 40.70% | 44.20% | 44.30% | 43.70% | 45.40% | 44.60% | 44.00% | 44.30% | 47.80% | 52.80% | 49.40% | 48.00% | 47.80% | 47.00% | 45.80% |
| ARO | 27.73% | 12.46% | 28.37% | 12.74% | 24.00% | 26.50% | 25.60% | 25.20% | 24.90% | 26.50% | 27.80% | 27.50% | 26.60% | 26.50% | 27.80% | 29.00% | 33.60% | 36.70% | ||||||||||
| PLCE | 31.62% | 8.11% | 32.71% | 5.12% | 29.00% | 28.30% | 28.40% | 28.30% | 28.80% | 29.00% | 30.00% | 31.00% | 35.80% | 35.60% | 33.30% | 33.90% | 35.10% | 35.50% | 33.30% | 31.90% | 31.50% | 32.10% | 32.00% | 31.10% | 30.10% | |||
| SSI | 23.24% | 8.94% | 23.35% | 2.70% | 20.60% | 22.60% | 22.30% | 22.50% | 23.10% | 24.00% | 30.60% | 25.80% | 21.90% | 20.20% | 20.90% | 22.20% | 22.30% | 23.20% | 22.90% | 23.50% | 23.90% | 24.10% | 23.80% | 23.60% | 23.70% | 23.60% | ||
| SMRT | 23.48% | 16.61% | 26.51% | 11.20% | 20.10% | 19.70% | 19.60% | 19.60% | 19.90% | 19.60% | 19.50% | 20.60% | 20.80% | 20.40% | 21.50% | 21.80% | 28.90% | 26.70% | 27.10% | 28.30% | 30.10% | 32.80% | 23.50% | 22.90% | 24.20% | 24.70% | 25.60% | 25.70% |
| BKE | 27.69% | 7.25% | 28.63% | 4.88% | 23.40% | 22.70% | 28.70% | 28.80% | 28.00% | 27.00% | 25.70% | 25.80% | 26.30% | 27.60% | 28.40% | 29.50% | 28.80% | 30.20% | 31.10% | 29.70% | 30.00% | 27.90% | 27.70% | 27.40% | 27.10% | 27.30% | 27.70% | |
| NWY | 32.33% | 19.46% | 34.45% | 15.47% | 24.50% | 25.10% | 24.10% | 25.20% | 23.20% | 33.50% | 34.10% | 36.30% | 38.30% | 38.30% | 37.20% | 37.00% | 37.80% | 38.00% | ||||||||||
| LB | 26.63% | 21.48% | 30.38% | 6.53% | 17.50% | 17.30% | 17.30% | 17.90% | 18.70% | 21.10% | 22.90% | 24.00% | 24.70% | 25.80% | 33.30% | 32.40% | 31.90% | 31.40% | 31.70% | 32.20% | 31.10% | 30.60% | 30.90% | 29.70% | 29.60% | 31.50% | 30.60% | 24.90% |
| URBN | 29.05% | 18.37% | 28.62% | 10.30% | 40.30% | 39.10% | 36.30% | 36.10% | 35.80% | 22.80% | 21.90% | 25.50% | 24.10% | 26.20% | 25.20% | 24.90% | 24.20% | 23.00% | 28.00% | 29.60% | 30.10% | 28.80% | 29.70% | 22.90% | 30.20% | 30.40% | 30.60% | 31.50% |
| PSUN | 32.52% | 31.09% | 41.57% | 13.78% | 23.20% | 23.40% | 24.70% | 23.90% | 22.40% | 21.90% | 22.00% | 22.70% | 25.60% | 24.90% | 23.40% | 33.80% | 31.70% | 36.50% | 38.30% | 40.60% | 46.00% | 48.20% | 47.40% | 45.80% | 44.00% | 45.00% | ||
| CATS:ITX | 38.61% | 6.03% | 40.31% | 2.17% | 35.40% | 35.50% | 36.80% | 36.60% | 35.90% | 34.90% | 36.50% | 38.80% | 39.90% | 39.50% | 39.10% | 41.10% | 41.40% | 40.90% | 41.00% | 40.20% | 40.90% | 40.60% | ||||||
| OM: HM | 38.61% | 5.21% | 39.56% | 5.04% | 37.30% | 36.10% | 36.40% | 38.10% | 37.80% | 37.00% | 37.00% | 37.30% | 37.50% | 37.00% | 37.60% | 38.70% | 40.20% | 40.10% | 41.60% | 41.40% | 41.90% | 41.90% | ||||||
| TSE: 9983 | 32.36% | 14.94% | 34.79% | 9.37% | 32.80% | 28.70% | 22.70% | 23.30% | 29.00% | 30.90% | 29.20% | 30.60% | 31.60% | 34.80% | 35.10% | 33.90% | 35.30% | 37.70% | 37.50% | 37.30% | 39.70% | |||||||
| JSE: MPC | 29.99% | 4.33% | 30.25% | 4.79% | 29.60% | 29.50% | 29.30% | 29.10% | 31.50% | 29.70% | 28.30% | 31.50% | 30.60% | 31.30% | 31.30% | 31.40% | 31.50% | 30.60% | 29.50% | 29.50% | 28.50% | 27.10% | ||||||
| TSE: 2670 | 32.95% | 14.48% | 36.05% | 4.17% | 26.20% | 26.40% | 26.40% | 23.50% | 29.10% | 32.00% | 35.60% | 34.10% | 34.30% | 34.90% | 35.50% | 35.60% | 37.30% | 38.40% | 38.30% | 37.10% | 35.40% |
Download Apparel-Accessories-Retailers-Operating-Expenses-Margins.xlsx
* The change in the operating expenses margin of ANF in 2003 is due to reclassification of the financial reports. The average and st.dev/average for ANF were computed from 2003.
The ratio of the standard deviation to average operating expenses margin is low for most of the companies, especially for the last 10 years period. It is also important to analyze the trend of change in operating expenses margins. Following is a chart of the average and median operating expenses margins of U.S. based and international companies:
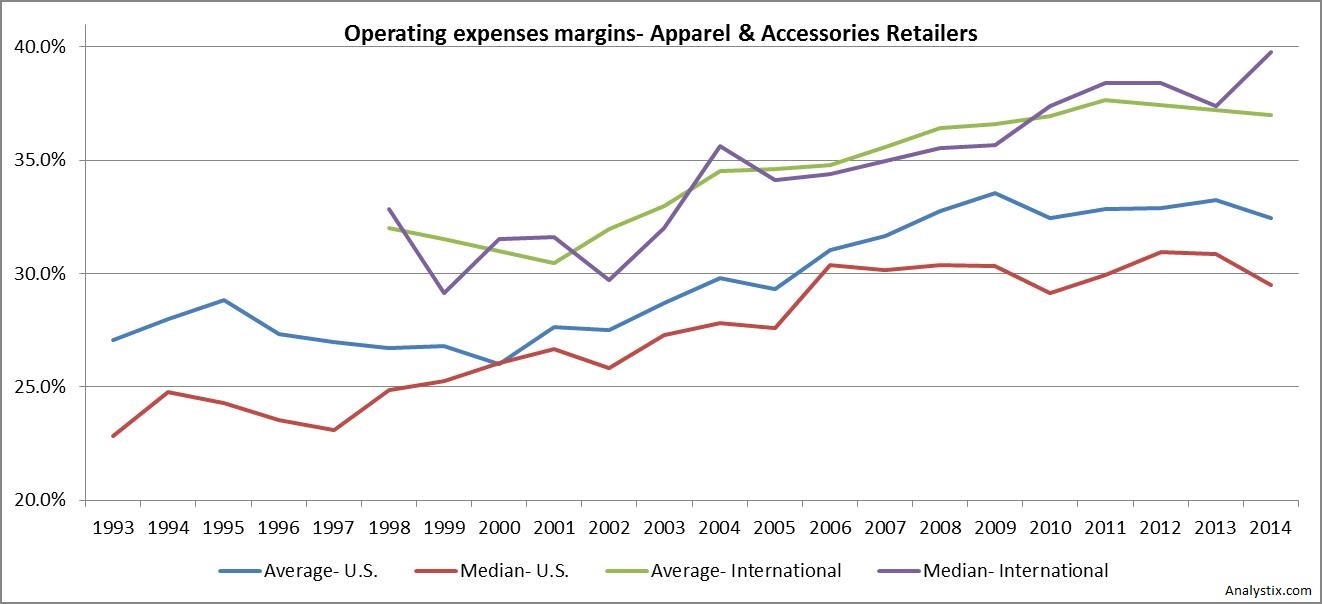
The chart is based on the data of the companies presented in the table above. The international average and median are based on a sample of 5 companies and we can’t deduce anything from the difference between U.S. based and international companies, but the trend over time seems to be the same. Operating expenses margins of apparel & accessories retailers seems to be constantly rising from the late 90’s until 2010-2011. The average annual increase in margins was 1.6% and 1.3% for the period of 1998 to 2011 for U.S. based and international companies, respectively.
An examination of the gross margin trends of individual companies compared to the average show that 38% present a strong positive correlation, 19% moderate positive correlation and 10% (2 companies) presented a moderate negative correlation. In total, it seems that most of the companies share the similar trend and deduction of individual performance from the average is possible, after the examination of the correlation.
Capital Expenditure
Cap Ex of apparel & accessories retailers is composed of expenditures related to maintain same stores and expenditures related to opening of new stores. Most companies provide information regarding the cost of opening a new store and the expected expenditure for existing stores in the financial reports. This makes modeling the expected cap ex very easy, but you should examine wherefore the costs expected in the past turned out to be the actual cap ex.
Working Capital
Future investment in working capital is mostly related to the anticipated increase in sales from same stores and opening of new stores. Regarding new stores, most companies provide information regarding the working capital needed as part of the disclosure regarding the cap ex which they plan to invest in those stores. The change in working capital of same stores is tied to the change in sales and can be computed in the usual way of calculating the ratios of inventory to revenue, accounts payable to revenue and receivables to revenue ratios. Companies which sell only to the end client will usually have very low receivables while companies which also sell to other retailers might have a significant amount.
Since the industry is very seasonal, working capital is likely to change during the year. If the working capital decreases in one of the quarters it doesn’t mean that all the cash on the balance sheet can be distributed to shareholders since the retailer will need to acquire more merchandise and increase inventory in the next quarter. The way to determine the real amount of working capital required to maintain a certain level of revenues is to calculate the working capital to sales ratio at the end of each quarter by using annual sales and the working capital presented in this quarters’ balance sheet. The highest ratio is the ratio to use in forward calculations. If the valuation is performed using the quarter with the highest working capital ratio, no adjustment until the end of the same year is needed. If we start the cash flow forecast in a different quarter then the working capital expense of the first period (in case of annual projection) will be the adjustment to the highest ratio determined in the analysis of the quarters.
For example, let’s say we perform the valuation using the financial reports of Q1 2015 so the first period forecasted is the last 3 quarters of 2015. We think that the financials of 2014 are a good representative of the future so we calculate the working capital to sales ratio of each quarter of 2014. So if in 2014 the revenue was 500 million and the working capital in the end of Q1 2014 was 80 million, the working capital ratio was 16%. We find out that the highest working capital ratio of the four numbers we receive (one for each quarter) was in the 3rd quarter, 20%. It means that while in the end of the 1st quarter the company did not have much working capital, it will soon need to invest money in increasing it. If we think that sales in 2015 will grow to 550 million, we will use the 20% working capital ratio in order to determine how much working capital the company need through the year, which is 110 million. The investment in working capital is 110 million minus the current working capital (Q1 2015) which is, let’s say, 85 million- hence, the investment in working capital in the first period forecasted would be 25 million.
Case Studies:
| Name | Summary |
|---|---|
| Zara | Description of the manufacturing, logistics and the use of data by Zara |
| American Eagle | Cross-channel marketing holiday case study |
| TJ Maxx | Review of TJ Maxx's history and business model |
| Discount Apparel | Description of the business model of discount retailers |
| H&M and Zara | Internationalization Process of Fast Fashion Retailers: Evidence of H&M and Zara |
| The Future of Shopping | An article about omnichanel retail |
| US Apparel Retail Industry Report 2012 | Analysis, DCF and key metrics of the apparel retail industry |