Parameters used in analyzing commercial real estate companies:
NOI, Net Operating Income: Revenues from rental properties (rent and management fees) net of operating and maintenance expenses. The equivalent of gross income in commercial real estate companies.
Same-site NOI: Used to compare the NOI from the same group of assets in 2 periods of time. This metric is used to examine the change in NOI which was not caused by change in the number of assets.
Occupancy/Vacancy: The occupancy of an assets or group of assets. Comparing the average occupancy of a company’s assets to the average occupancy in its market of operation can indicate the quality of the assets and management. Improving occupancy will increase NOI, and vice versa.
Cap Rate/NOI Yield: The NOI of an asset or a group of assets divided by its fair value. A very important metric which can be used to evaluate the fair value of assets when compared to cap rates of similar assets. Several commercial real estate services companies publish data regarding average cap rates of various types of commercial real estate in different markets.
FFO, Funds From Operation: Measures the net cash flow to the shareholders of the company, the cash flow which was generated by its real estate leasing operations. The FFO excludes non cash flow items like gains from real estate revaluation, depreciation, non-cash interest expense and non-cash taxes.
FFO Multiple: The market value of the company divided by its FFO. The equivalent of the P/E multiple in commercial real estate companies.
Parameters used in a cash flow forecast:
Revenues from rental properties:
The revenues from rental properties are derived from the rent paid by the lessors, which means that it is the product of the leased area and rent per unit of the area.
Leased area is dependent on the total leasable area of the firms’ properties and the occupancy rate. The firm controls its total leasable area which can be decreased by selling assets and increased by buying or building new assets. Occupancy is also dependent on the firms’ actions but in a less direct way- for example, it can lower rent in order to attract new lessors to its properties, or to renovate the property.
A firms’ average occupancy is also dependent on the average occupancy in its real estate market. The market is usually defined as the city of operation but it also depends on the property type- the competition of an office building is usually a bigger area than the competition of a retail property. The statistics that can be found on the internet is mostly for whole cities so it is harder to find data for smaller areas.
The average market occupancy is a dynamic number which is affected by demand (office jobs for office, consumer spending and population is capture area for retail) and supply (construction of new properties of the same type). The academic literature also defines a “natural” occupancy rate which is different for each market (the number which is mostly used is the long term average of the specific market), but also might change in the long run. The occupancy changes in a cyclical manner and most of the research in the field advices to model occupancy and rent levels not by the current trend but as a cycle. The basic model suggested by Prof. Glenn R. Mueller divides the cycle into 4 phases: Recovery, Expansion, Hyper Supply and Recession. Following is the description of the occupancy and rent model:

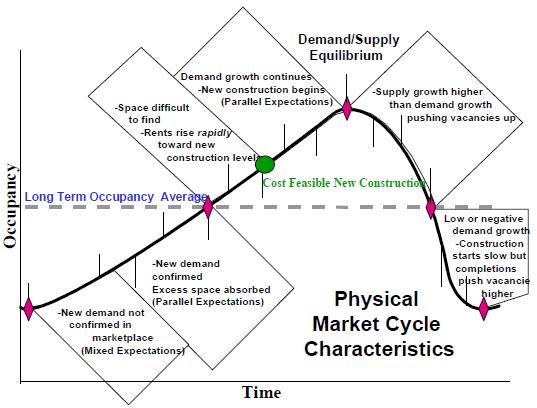
* from the article: Predicting long term trends and market cycles in commercial real estate. G.Mueller
According to this model, the change in rent levels is dependent on the cycle. In the expansion phase, while the occupancy is lower than the natural rate, rents tend to rise in nominal terms but slower than the inflation. Once market vacancy reaches the natural rate the rent growth increases in a higher rate and the market reaches a rent level in which it is profitable to start new construction. Past the peak, in the hyper supply phase, as new supply becomes available, occupancy starts to decrease; rents are still rising but at a slower rate and once the vacancy eventually falls below the natural rate the rent growth rate decreases in real terms and eventually even in nominal terms. It is important to note that the actual change in the average rent of a specific firm may be different than that of the market and that firms can prepare to an anticipated increase or decrease in market rent levels. The difference is caused by the lease period- when a firm anticipates increase in market rents it will try to sign short leases so it will be able to increase rents when they are due and the opposite- in decreasing rents firms will try to sign for longer periods in order to avoid the recession phase of the market.
Here are some examples of market rent forecast models:
Historic statistical data model:
This model uses past statistical data which can be found in academic articles:
Mueller divided each phase into 4 points to a total of 16 points and calculated the average annual change in rent for each point, based on 30 years of statistical data in 54 different office and industrial markets:
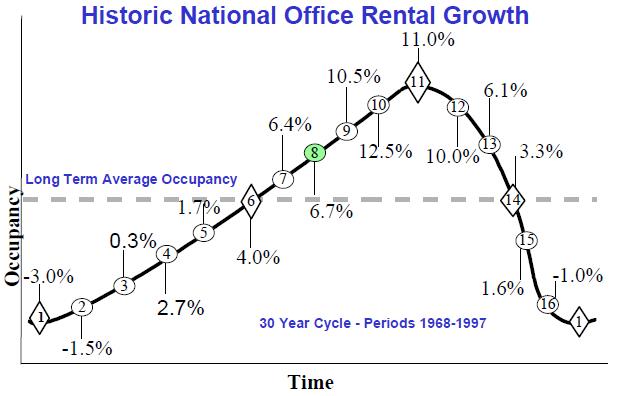
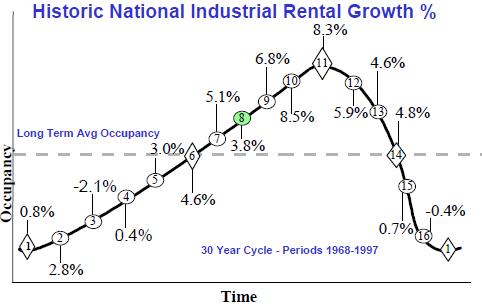
* from the article: Real Estate Rental Growth Rates at Different Points in the Physical Market Cycle. G.Mueller
It’s important to note that there is a difference between the office and the industrial markets; the office market starts with occupancy of 77%, a peak at 95%, and long term average occupancy of 87% while the industrial market starts with occupancy of 87%, a peak at 95% and long term average occupancy of 92%. The average occupancy and rent growth statistics for each phase can be found in the following link:
Real Estate Rental Growth Rates at Different Points in the Physical Market Cycle
Page 10 describes the office market and page 11 describes the industrial market.
There are also statistics regarding the chance that the market will shift to a new phase in the next quarter for different types of properties. It can be found in the following article (pages 27 to 31):
Forecasting Five Property Types’ Real Estate Cycles as Markov Chains
For example, if the market is in phase 8 in the retail market (page 31), the chance that it will stay in the same market in the next quarter is 63% and the chance that it will shift to the 9th phase is 22%.
The possible application of all this data in your DCF model is that you can identify the current phase of the cycle of the target market and calculate the average rent change based on the sum of product of phase change probabilities and their average rent change. There are also research firms which provide phase estimation for various markets, like Cycle Monitor by Dividend Capital Research. For example:
Cycle Monitor- Real Estate Market Cycle- Fourth Quarter 2014 Analysis
Econometric model:
This model will use macro and micro economic data in order to estimate occupancy and rent growth. You need to collect data of economic indicators which affect the occupancy and find the regression equations which describe the target market. Following is a list of possible dependent and independent variables by property type:
| Property Type | Independent Variable | Dependent Variable |
| Office | Employment growth in finance, insurance, real estate and IT | Occupancy- Demand |
| Office | Unemployment rate | Occupancy- Demand |
| Office | GDP growth | Employment growth in finance, insurance, real estate and IT |
| Office | New office construction | Occupancy- Supply |
| Retail | Private Consumption growth | Occupancy- Demand |
| Retail | New Retail properties construction | Occupancy- Supply |
| All Property Types | Occupancy | Rent growth |
| All Property Types | Inflation | Rent growth |
Some conclusions based on research in the field of real estate market cycles which can also help with finding various correlations and provide thumb rules:
- The best indicator of the cycle phase is vacancy rate.
- Office market rents adjust in response to local and national economic conditions.
- Office overbuilding and market cycles resulted from a decline in nominal interest rates that raised developers’ projections of GNP growth and future demand for space.
- Dynamic markets tend to have lower occupancy rates compared to static markets.
- Cycles in a metropolitan level might be different from each other and from the national aggregate.
- Peaks and troughs of the real rent cycle tend to lag the peaks and troughs of the vacancy cycle by about one year.
- Property cycles have durations ranging from 4 to 12 years with an average of 8 years.
- The volume of investment in the office market tends to be the most volatile, industrial the least volatile while the volatility of the retail and residential markets falls between the two.
- Housing investment leads fluctuations in GDP while a non-residential investment lags GDP
NOI Margin:
NOI margins, or NOI to revenues, varies between properties and locations and is mostly dependent on the lease terms and occupancy rate.
There are countless sorts of lease contracts which define the payments made by the lessor and payments made by the lessee (basic examples are gross, net, triple net, etc.). The type of the contract affects the rent paid by the lessee and operating costs paid by the lessor. As a rule of thumb, NOI does not change due to change in contract type because both the lessor and the lessee make decisions based on the net payment made/received which is reflected in the NOI and not in the gross revenues.
Occupancy rates of the properties in the portfolio might affect the NOI margin and changes in NOI at a given gross revenue level. Lower occupancy in a given property means that the lessees pay less operating fees to the owner, but since some of the buildings’ operating expenses are fixed, the owner needs to participate in a bigger portion on the costs. The conclusion is that as new tenants enter yet unoccupied space in a given property, the NOI from that property will rise in a faster pace compared to the rise in revenues which is based on the additional rent payments. This is also the reason why properties with very low occupancy levels might yield negative NOI. The application of this phenomenon in valuation is that when you try to compute a representative NOI of a property with currently low occupancy, take into account that adjusting the current NOI to a higher occupancy by multiplying it with a natural occupancy level and dividing by the current occupancy level will probably give a conservative number.
Selling, General and Administrative Expenses:
SG&A expense of commercial real estate companies tends to change in line with the change of the revenues of the company- as the number of owned properties increases so does the SG&A. Following is the change in the SG&A to Revenues ratio of some of the largest office and retail REITs in the U.S over the years:
| Company | Average | St.Dev/Average | 1998 | 1999 | 2000 | 2001 | 2002 | 2003 | 2004 | 2005 | 2006 | 2007 | 2008 | 2009 | 2010 | 2011 | 2012 | 2013 | 2014 |
|---|---|---|---|---|---|---|---|---|---|---|---|---|---|---|---|---|---|---|---|
| SPG | 7.05% | 26.68% | 3.81% | 3.67% | 3.48% | 5.76% | 5.45% | 8.52% | 8.37% | 8.66% | 8.61% | 8.54% | 8.48% | 7.32% | 7.29% | 8.14% | 7.54% | 7.53% | 8.71% |
| GGP | 3.08% | 39.20% | 1.08% | 0.98% | 0.93% | 4.73% | 4.32% | 3.88% | 3.64% | 3.04% | 2.49% | 3.18% | 2.82% | 5.11% | 3.40% | 2.81% | 3.11% | 3.18% | 3.68% |
| MAC | 2.36% | 24.68% | 1.56% | 1.72% | 1.78% | 2.13% | 2.14% | 1.87% | 2.43% | 1.97% | 1.96% | 2.26% | 2.03% | 3.58% | 3.23% | 2.89% | 2.68% | 2.95% | 2.88% |
| O | 7.22% | 8.28% | 7.52% | 6.42% | 5.96% | 6.76% | 6.99% | 7.42% | 7.62% | 7.90% | 7.45% | 7.95% | 6.68% | 6.49% | 7.60% | 7.53% | 7.89% | 7.35% | |
| KIM | 10.93% | 34.39% | 5.48% | 5.49% | 5.77% | 6.56% | 7.39% | 8.21% | 8.86% | 11.20% | 13.10% | 15.00% | 15.30% | 14.50% | 13.80% | 14.90% | 14.10% | 13.50% | 12.70% |
| DDR | 9.71% | 21.69% | 6.03% | 7.30% | 7.92% | 8.53% | 9.05% | 10.00% | 8.97% | 8.54% | 8.56% | 10.10% | 13.30% | 14.00% | 12.20% | 11.40% | 10.90% | 9.78% | 8.53% |
| CBL | 4.49% | 11.97% | 4.75% | 5.30% | 5.17% | 3.61% | 4.13% | 4.53% | 4.68% | 4.55% | 4.08% | 3.74% | 3.88% | 3.95% | 4.29% | 4.57% | 5.33% | 4.85% | 4.96% |
| RPAI | 3.50% | 35.32% | 3.74% | 2.18% | 2.20% | 2.40% | 2.96% | 3.37% | 3.13% | 3.95% | 5.13% | 5.89% | |||||||
| FRT | 5.65% | 15.43% | 5.29% | 5.01% | 5.20% | 5.30% | 4.66% | 3.51% | 4.93% | 6.39% | 6.24% | 6.47% | 6.20% | 5.26% | 5.54% | 6.67% | 6.63% | 6.55% | 6.28% |
| REG | 10.34% | 25.83% | 11.10% | 6.90% | 6.51% | 6.34% | 6.90% | 7.38% | 8.99% | 10.60% | 12.20% | 12.50% | 10.70% | 10.30% | 14.00% | 12.80% | 13.70% | 13.10% | 11.70% |
Download Commercial-Real-Estate-SGA-to-Revenues.xlsx
It seems that the ratio didn’t change much for each company. Out of total of 162 samples, 20% were with a difference of more than 1% from the average ratio of their company over the sample years, 13% were with a difference larger than 2% and only 8% were with a difference of more than 3%.
Regression of the annual change in revenues as the independent variable and same year change in SG&A as the dependent variable found a statistically significant positive correlation- a 1% change in revenues leads to 0.48% change in SG&A. According to this is seems that as revenues increase, the SG&A also rises but at a slower pace. It is important to note that although the coefficient of the change in revenues was statistically significant, the R-squared was very small, only 6%. Since the SG&A ratio to Revenues of the sample companies did not change much, the reason for the small explanatory ability of the regression model might be caused by a longer than a year SG&A adjustment period.
Despite the difference in the SG&A to Revenues ratio across companies, economies of scale do exist in the commercial real estate industry and larger firms do tend to show lower SG&A to NOI ratios. A sample of the 50 largest office REITs (24 firms) and retail REITs (26 firms) in the U.S. showed that the higher the NOI of the company, the lower the SG&A to NOI ratio. The R-squared is a bit low but the coefficients are statistically significant. Following is the summary of the regression results (SG&A to NOI ratio as the dependent variable, the natural logarithm of the NOI as the independent variable):
| Dependant Variable: | SG&A/NOI | |||
| Market | Office | Retail | All | |
| Samples | 24 | 26 | 50 | |
| Independent Variables: | ||||
| const | coefficient | 0.3234331 | 0.2636185 | 0.2901473 |
| p-value | 0.0051 | 0.0007 | 0.0000 | |
| Ln(NOI) | coefficient | -0.0344123 | -0.0261926 | -0.0297375 |
| p-value | 0.0626 | 0.0285 | 0.0035 | |
| R-squared | 0.1488 | 0.1845 | 0.1646 | |
| P-value(F) | 0.0626 | 0.0285 | 0.0035 | |
Interest Expenses:
Interest expenses are the major constituent of the total expenses of commercial real estate companies. Therefore, a small change in the average interest rate paid for the debt holders may significantly affect the FFO. Some of the major determinants of the cost of debt are:
- Market risk free rate
- Market risk premium
- Leverage and liquidity of the specific company
- Terms of the specific debt liability
Different markets tend to have various standards of debt terms- Unsubordinated, Subordinated, Non-Recourse, etc. The terms of the specific debt liability may have a greater influence on its cost compared to the influence of the leverage and liquidity ratios of the company itself.
Tax Expenses
Since Non-REIT companies pay taxes, it is important to understand what influences tax expenses. It is harder for IFRS companies since depreciation is not displayed in the financial reports, but the firm does list it as an expense in its reports to the tax authorities. Therefore, tax rates calculated using the public financial statements tend to be much lower compared to the country of operation corporate tax rate. IFRS companies also include non-cash tax expenses caused by revaluation of real estate properties, the total of those expenses are shown in the deferred tax expenses account in the liabilities part of the balance sheet. When computing the tax rate for use in the FFO forecast, it is important to only use the tax rate calculated using the actual cash flow tax expense and not the amount shown in the income statement. Also, it is important to note that in the long term, as the company will write-off most of the building cost as depreciation, its tax rate will grow.
Useful Links:
Since most of the macro and micro economic variables which affect the real estate cycles and local, the relevant data will be found in website of the local statistics bureau. Additionally, were are several real estate research firms which provide information regarding rents, occupancy, cap rates and more for various countries. Following are websites of companies which provide this free data (some ask you to register):
| Company | Data description |
|---|---|
| Cushman & Wakefield | Local market reports for office, retail and industrial properties including market outlook, rent and yields data of various countries and cities |
| Jones Lang LaSalle | Local market reports for residential, office, retail and industrial properties including market outlook, rent, occupancy and yields data of various countries and cities |
| CBRE | Local market reports for office, retail and industrial properties including market outlook, rent and yields data of various countries and cities |
| Colliers | Local market reports for office, retail and industrial properties including market outlook, supply, investment and yields data of various countries and cities |
| BNP Paribas Real Estate | Local market reports for hotel, office, retail and industrial properties including market outlook, investment volume and yields data of various countries and cities in Europe |