Revenue Forecasting
Revenue forecasting is usually the first stage of future cash flows forecast, used both in business budgeting and company analysis (for debt analysis or equity valuation). Those type of analysis begin by estimating the top row, revenues, and afterwards going through the various accounting items, each with its own assumptions.
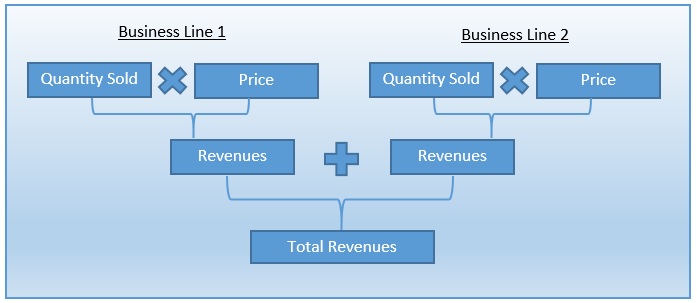
The revenues of a company are the product of quantity sold (or service provided) and price:

For companies with various products and business lines, it is the aggregate of those calculations for each product/business line. Also, if the company operates in several geographic areas with different characteristics, we can separate the geographical regions and calculate the quantity*price equation for each region. For example, the revenues of a real estate company which rents office space is the product of the total rented square foot multiplied by the average price per square foot. We can perform the calculation for each building rented by the company for an increased accuracy: price trends in various geographical areas might be different and not all the buildings have the same vacancy. The decision of the division of the aggregate revenues to various business lines/geographical areas is mostly based on the data we have. If the financial reports provide details for several business lines, we can forecast revenues for those business lines because the data provided by the company will be coherent with our calculations.

Once we decided on the division of the total revenues between business lines, we can start forecasting the quantity and price variables for each.
Quantity Forecast
There are multiple methods to forecast the quantity of products sold. The choice of the method is usually based on the amount of data available- both the data provided by the company and market data. The quantity forecast method also depends on the characteristics of the company analyzed. Usually, a large, mature company in a mature and established market will not need the specification and drill down to details as a young company with a new product.
The 3 basic methods are as follows:
Forecast revenues based on macro-economic data
Forecasting the quantity sold based on macro-economic data forecast, such as GDP growth or population growth. This assumption in using this method is that the market in which the company operates is closely tied to the macro-economic indicator used, and that the company will keep its’ market share. This is the reason why this method is largely used for mature companies in mature markets, or highly regulated markets with high barriers for new competitors. If you have enough historic data, you can examine past correlation between the quantity sold by the company and several macro-economic indicators, and select the one with the highest correlation. If the company analyzed operates in several countries, you can create a different forecast for quantity sold for each country, based on its forecasted macro-economic data. For example, for a large utilities company which operates numerous power plants, we should check the correlation between the GDP growth and power consumption in the geographical areas of operation, and use the forecasted GDP growth to forecast the demand for the energy produced by the company.
Historic macro-economic data can be found online in the website of the local statistics bureau. To use this data in a correlation test, we need it to be arranged in the same periods as the data provided by the company- usually, quarterly or annual. If this is not the case, you can use the Data Arranger Excel Add-in, found in the Analystix Tools package, to easily rearrange the data to the required periods. Forecasts of macro-economic data can be usually found in the website of a local central bank or OECD and IMF websites.
Forecast revenues by forecasting company market share
The market share method assumes a certain market share for the product sold by the company in a future representative year. To use this period, we need data regarding the market size of the company’s products. This data can be often found online, or can be computed by using a known market share for a company in the same industry. Then, we estimate the stabilized market share of the company analyzed in the long term, and the period in which the company will reach this target. The quantity sold in the periods between the current period and this representative year is usually forecasted using a simple linear equation.
For example, let’s assume a young and growing cement company which holds a 10% market share in a market assumed at a current size of 70 mil’ ton. The CEO of the company declare that their target is 20% market share, which seems reasonable given that were are only 3 other cement companies in the country, one of them is currently experiencing financial difficulties. Based on that information we can forecast that in a long term steady state it will grow until reaching a 20% market share, in 6 years. By researching the market we find a government forecast which estimates the demand to be at 85 mil’ ton at 6 years. Based on this data, we forecast the quantity of cement sold by the company to be 17 mil’ ton in 6 years, compared to current 7 mil’ ton. We can estimate the quantity sold in each year from now until year 6 using a simple linear equation, growing by 1.7 mil’ ton each year:

Forecast revenues by creating a specific formula
The specific formula method is the most thorough and logical method, but it is highly dependent on the amount of data provided by the analyzed company. The method is to construct a formula using the various variables which affect the quantity of products sold. We begin by identifying those variables, usually by extracting data from the company reports. Then, we construct a formula, the solution of which is the quantity sold. This process is performed by trying to formulate the actual selling process of the company. After we create the formula we should test it using historic data. If it fits, the next step is to forecast the values of the various variables into the future. Then, by entering the forecasted values into the formula for each time period, we can forecast the quantity sold.
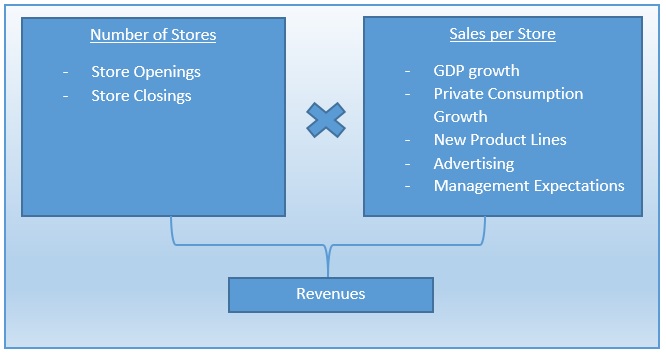
For example, for an apparel retail company, the quantity of products sold is usually highly dependent on the number of stores and sales per store. So, we can construct a formula according to which the quantity sold is the product of those two variables. But, as we think of the actual selling process, we notice that while closing stores affect revenues immediately, new stores take some time to reach their full potential- so we need to incorporate those insights into the formula. Then, we would check that historic revenues are correlated to our equation. If they do, our formula fits and we will try to forecast future store openings and closings and sales per store. If the management of the company provides the number of stores it plans to open in the next years, we can check if historic management forecasts were accurate. If they were, we can input those numbers into our formula. The sales per store can be forecasted using the correlation with the GDP growth method, or other assumptions based on new product lines, advertising, management expectations, etc. After we forecasted the two variables, we would input them into our equation and receive a forecast of quantities sold.

Price Forecast
The second stage in revenue forecasting is to forecast the change in the prices of the products or services sold. Much like the quantity forecast, the choice of method is usually based on the amount of data available. If we can analyze the demand and supply characteristics of the market, we can make assumptions regarding future price movements. Otherwise, we will check if past price movements were correlated to the inflation, and if they were, assume that this trend will continue in the future.
Analyzing supply and demand
If we have enough historical data regarding the supply and demand characteristics of the market, and historical price movements, we can calculate their correlation. Then, we will use forecasts or make assumptions regarding short and medium term over/under supply in the market, and calculate the corresponding change in prices. For example, if we analyze the housing market and see that while the population exhibit positive growth, new construction decreased due to decrease in the number of construction permits in the area, we can deduce that housing prices would go up in the short term. In the long term, it is uncommon to assume that over/under supply will continue, and the main assumption is stable, or same as inflation change in prices.
Real or Nominal model- Analyzing correlation with inflation
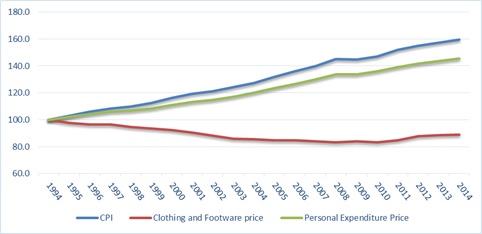
Cash flows can be forecasted in real or nominal terms, which means, linked or non-linked to inflation. The choice is based on the question- do we assume that the prices in the market for company’s products or services will imitate the changes in inflation, or not. To answer this question, we need to check past correlation. You can find the historic price trends for various industries and countries in the OECD.Stat database, and compare it to the CPI in that country. For example, following is the historic trend in the CPI, Personal Expenditure and the Clothing and Footwear price indices in the U.S:

We can see that while the CPI and Personal Expenditure price index increased in approximately the same rate, the trend of clothing and footwear prices was very different and actually showed a decline. According to this, if we are trying to create a forecast of a Clothing and Footwear retailer, the model should be in nominal terms. The prices linkage of the forecast, nominal or real, will also determine the cost of capital. For nominal forecasts we will use the nominal risk free rate, and for real forecasts the inflation linked risk free rate.


